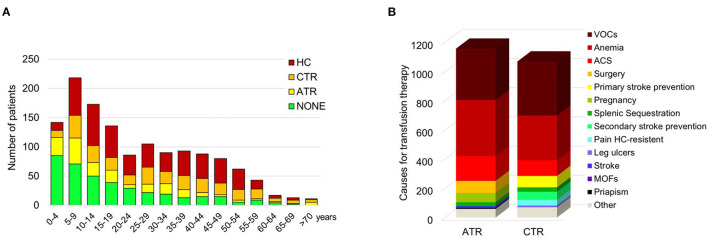
Figure 2.
(A) Distribution of sickle cell disease (SCD) patients by age and therapy. Data are shown as a column chart that reports, for each age group, the number of patients that received HC/ATR/CTR/NONE as their therapy regimen. (B) Distribution of the indications for transfusion therapy. Data are shown as counts of the indications for ATR and CTR. ACS, acute chest syndrome; ATR, acute transfusion; CTR, chronic transfusion; HC, hydroxycarbamide; MOFs, multi-organ failures; VOCs, vaso-occlusive events.

