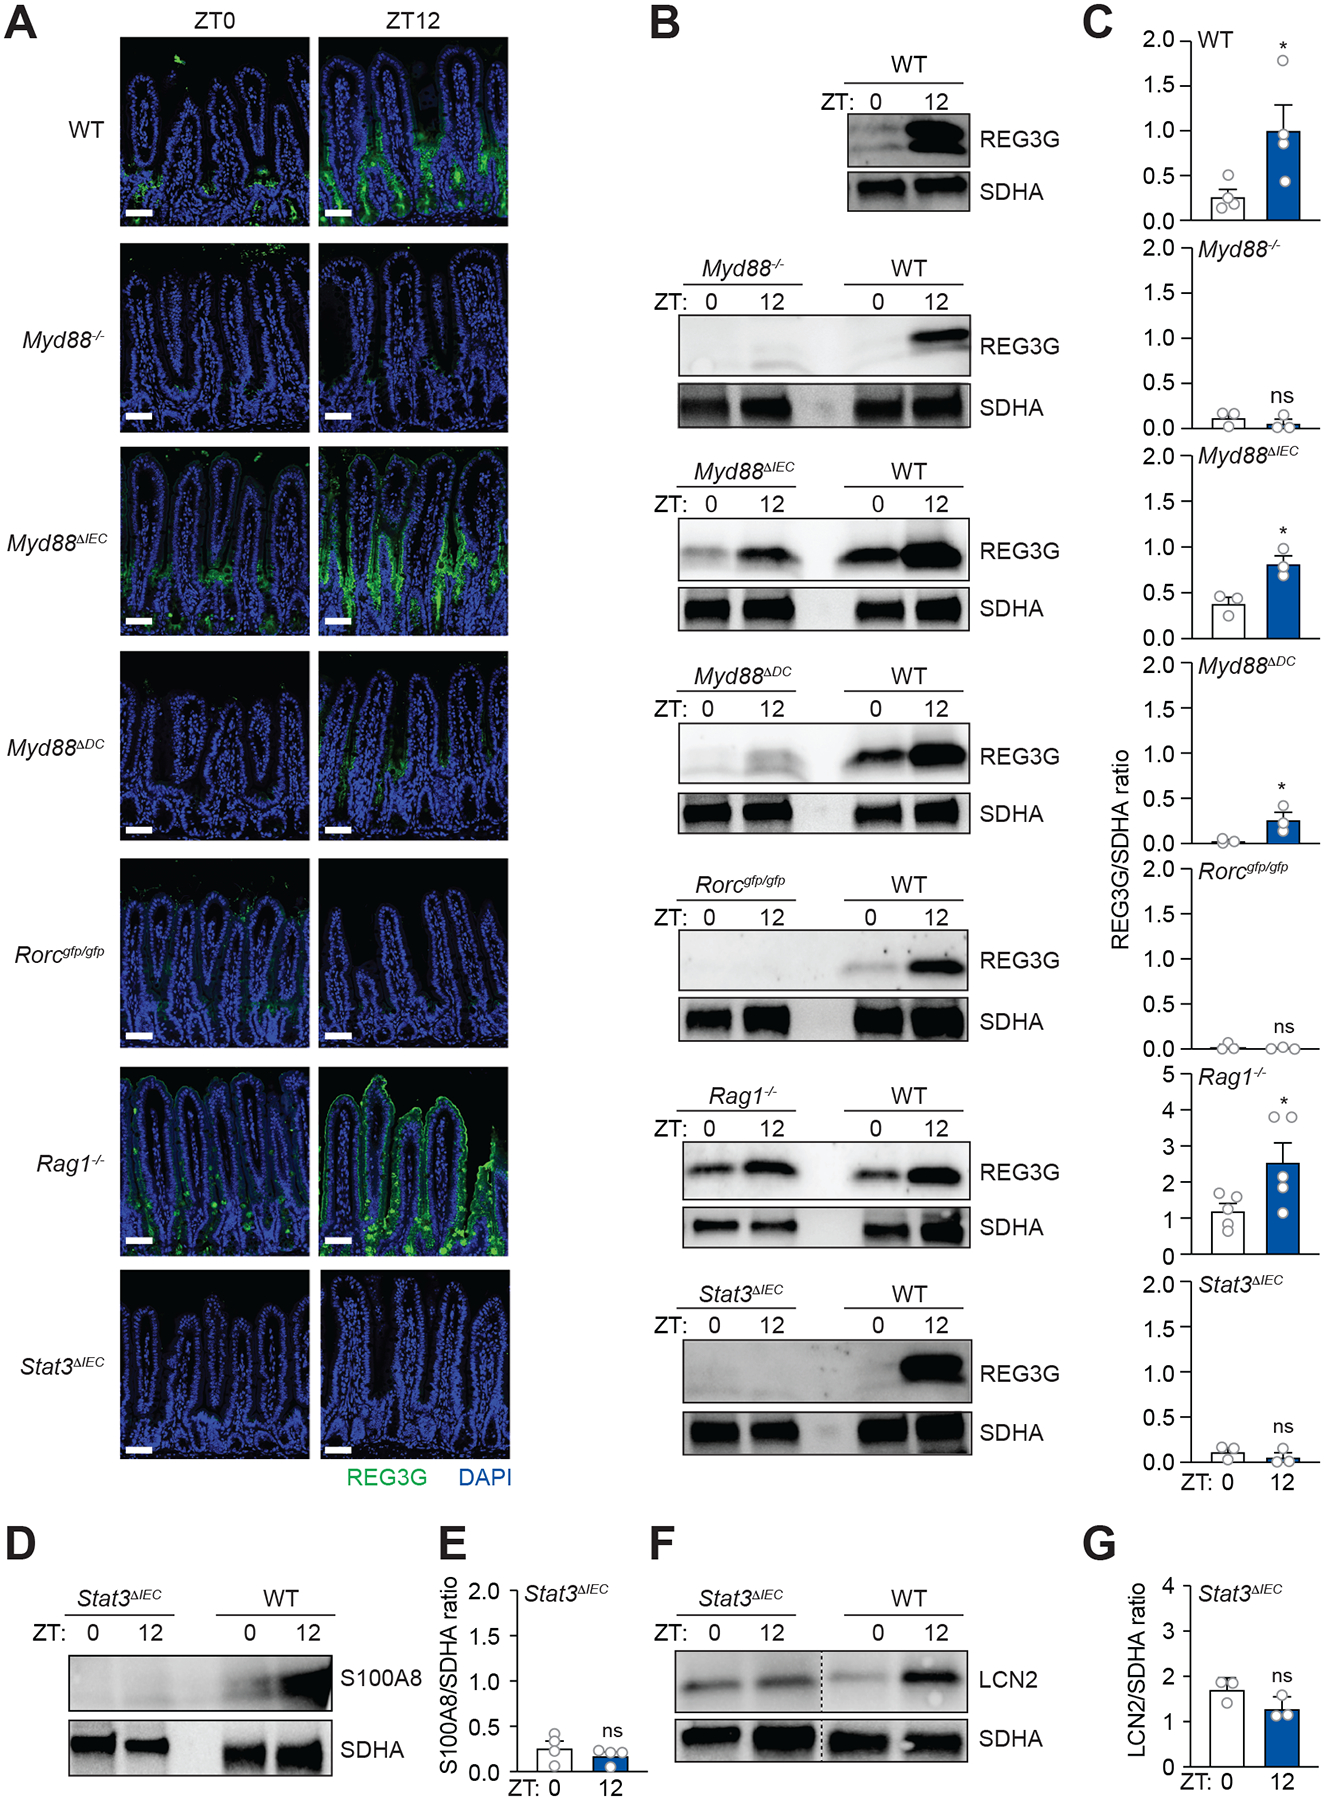
Figure 3. An ILC3-STAT3 signaling relay drives diurnal rhythms in REG3G expression.

(A) Immunofluorescence detection of REG3G in the small intestines of wild-type (WT), Myd88−/−, Myd88ΔIEC, Myd88ΔDC, Rorcgfp/gfp, Rag1−/−, and Stat3ΔIEC mice. Scale bars, 50 μm.
(B and C) Representative immunoblot of small intestines from WT, Myd88−/−, Myd88ΔIEC, Myd88ΔDC, Rorcgfp/gfp, Rag1−/−, and Stat3ΔIEC mice, with detection of REG3G and SDHA (control) (B). Band intensities were quantified by densitometry (C).
(D and E) Representative immunoblot of small intestines from Stat3ΔIEC mice, with detection of S100A8 and SDHA (control) (E). Band intensities were quantified by densitometry (F).
(F and G) Representative immunoblot of small intestines from Stat3ΔIEC mice, with detection of LCN2 and SDHA (control) (G). Band intensities were quantified by densitometry (H).
ZT, Zeitgeber time. All results are representative of at least three independent experiments. Means ± SEM are plotted; *p < 0.05, **p < 0.01, ns, not significant by Student’s t test. See also Figures S5 and S6.
