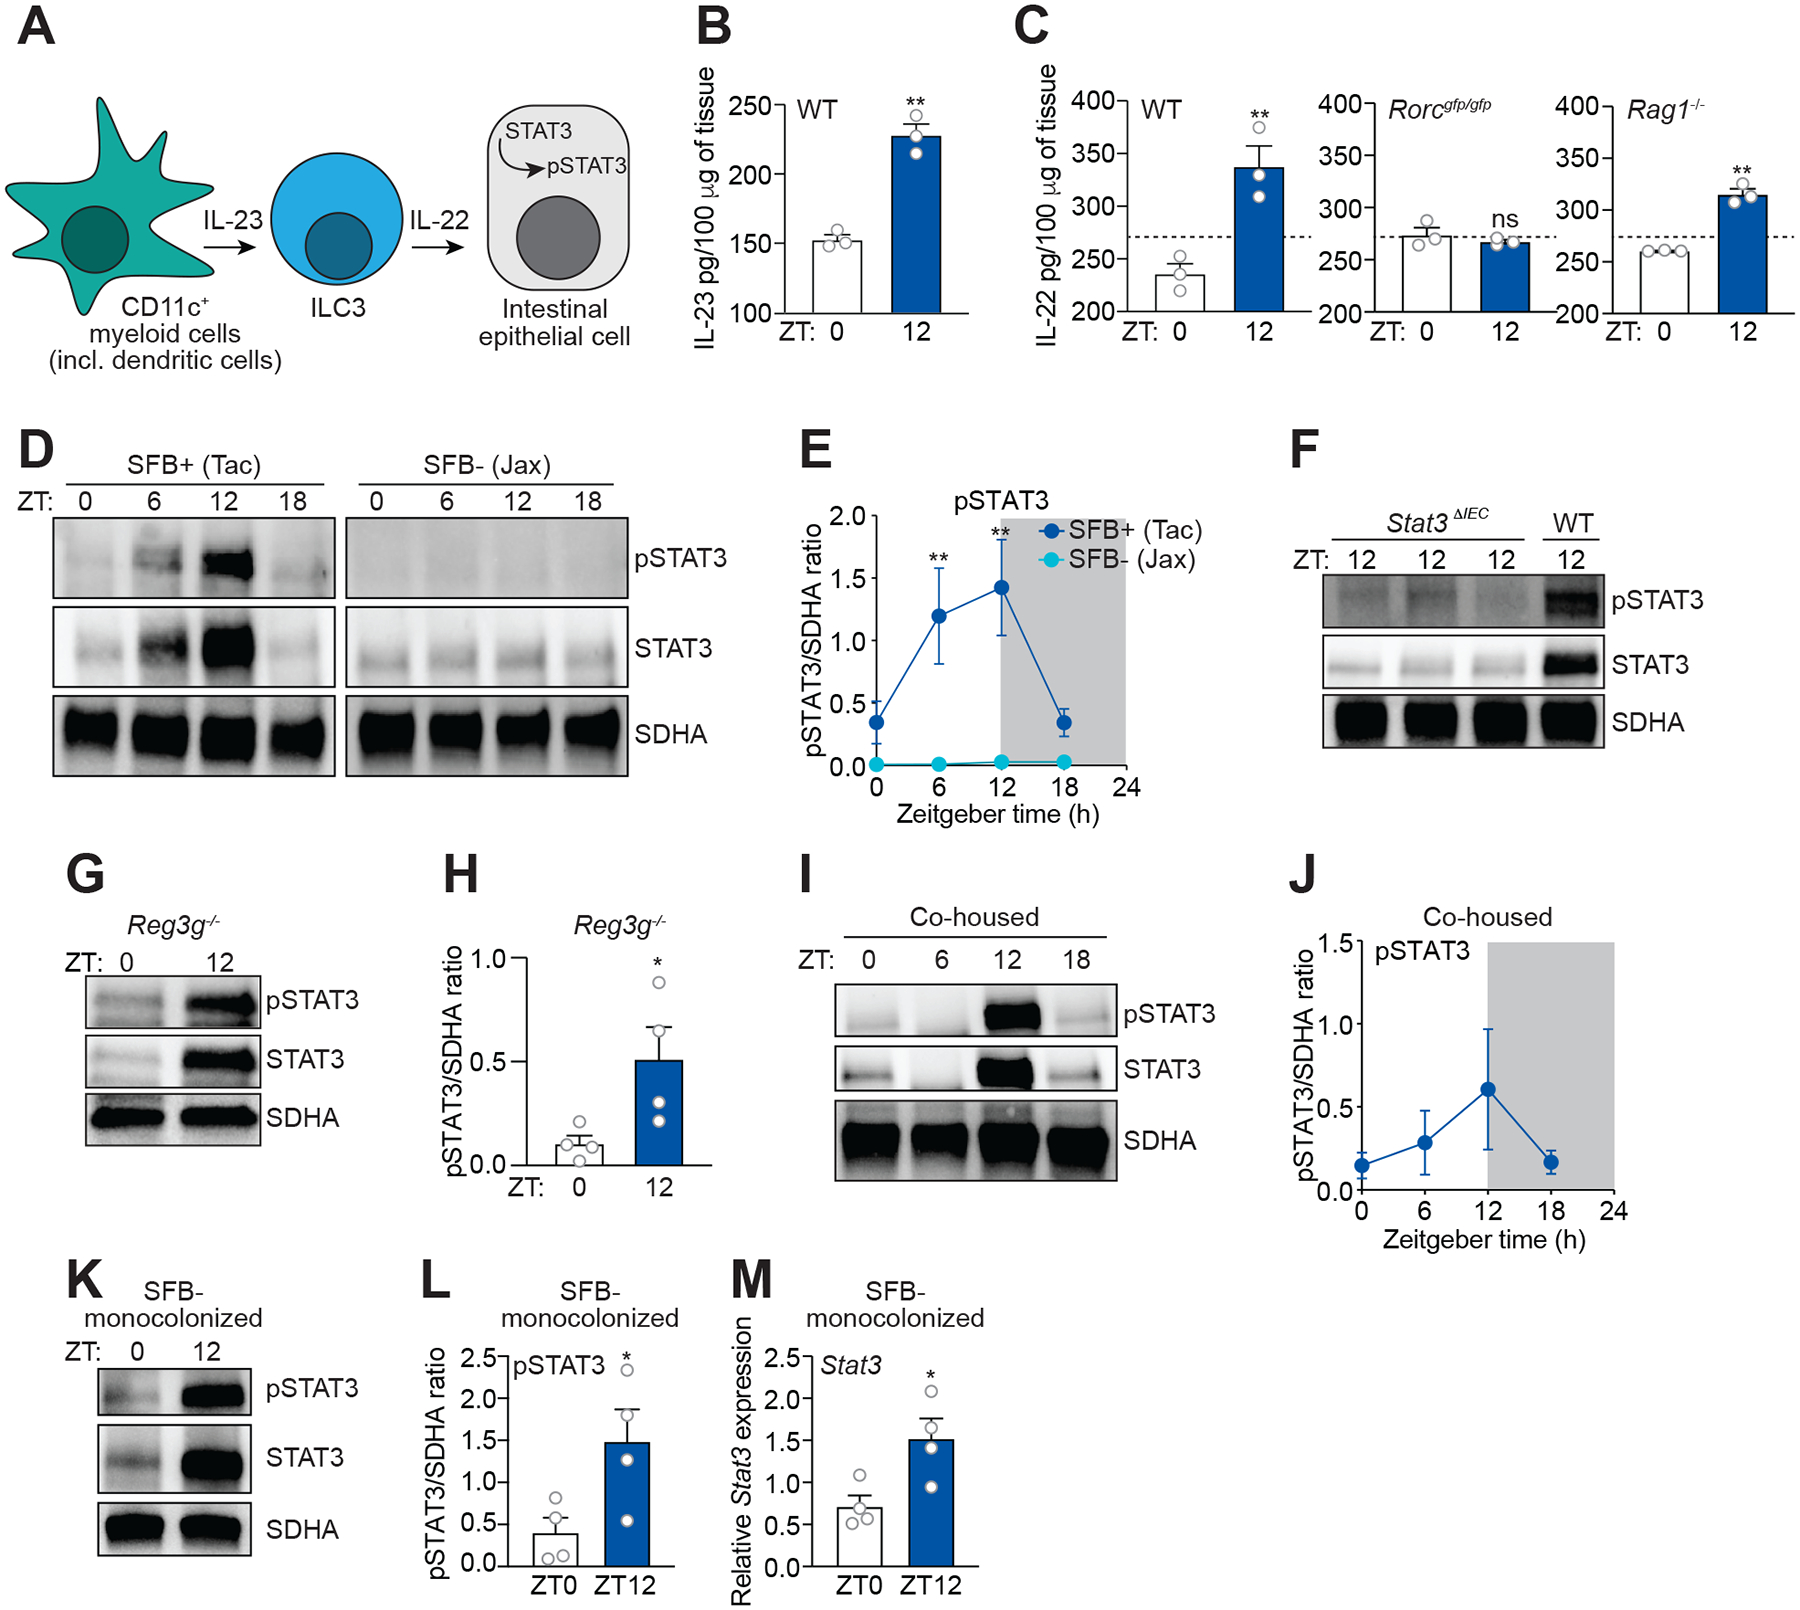
Figure 4. SFB drive diurnal rhythms in STAT3 expression and activation.

(A) Schematic of the small intestinal ILC3-STAT3 pathway.
(B) Measurement of IL-23 in mouse small intestine by enzyme-linked immunosorbent assay (ELISA). n=3 mice per group.
(C) Measurement of IL-22 in the small intestines of wild-type (WT), Rorcgfp/gfp, and Rag1−/− mice by ELISA. n=3 mice per group.
(D and E) Representative immunoblot of small intestines from SFB+ (Tac) and SFB− (Jax) mice, with detection of STAT3, pSTAT3, and SDHA (control) (D). Band intensities were quantified by densitometry (E). n=3 independent experiments.
(F) Immunoblot of WT and Stat3ΔIEC mice, with detection of STAT3, pSTAT3, and SDHA (control). Representative of three independent experiments.
(G and H) STAT3 and pSTAT3 rhythms are maintained in Reg3−/− mice. (G) Representative immunoblot of small intestines from Reg3g−/− mice, with detection of STAT3, pSTAT3, and SDHA (control). (H) Band intensities were quantified by densitometry. n=4 independent experiments.
(I and J) Representative immunoblot of small intestines from SFB− (Jax) mice that were co-housed with SFB+ (Tac) mice for 14 days with detection of STAT3, pSTAT3, and SDHA (control) (F). Band intensities were quantified by densitometry (G). n=3 independent experiments.
(K and L) Representative immunoblot of small intestines from SFB-monocolonized mice, with detection of STAT3, pSTAT3, and SDHA (control) (H). Band intensities were quantified by densitometry (I). n=4 independent experiments.
(M) Q-PCR measurement of Stat3 transcript abundance in small intestinal epithelial cells recovered by laser capture microdissection from mice monocolonized with SFB for four weeks. Tissues were collected at two timepoints across the day-night cycle. n=4 independent experiments.
ZT, Zeitgeber time; SFB, Segmented filamentous bacteria; Tac, Taconic; Jax, Jackson. Means ± SEM are plotted; **p < 0.01, ***p < 0.001 by Student’s t test. See also Figure S6 and Table S1.
