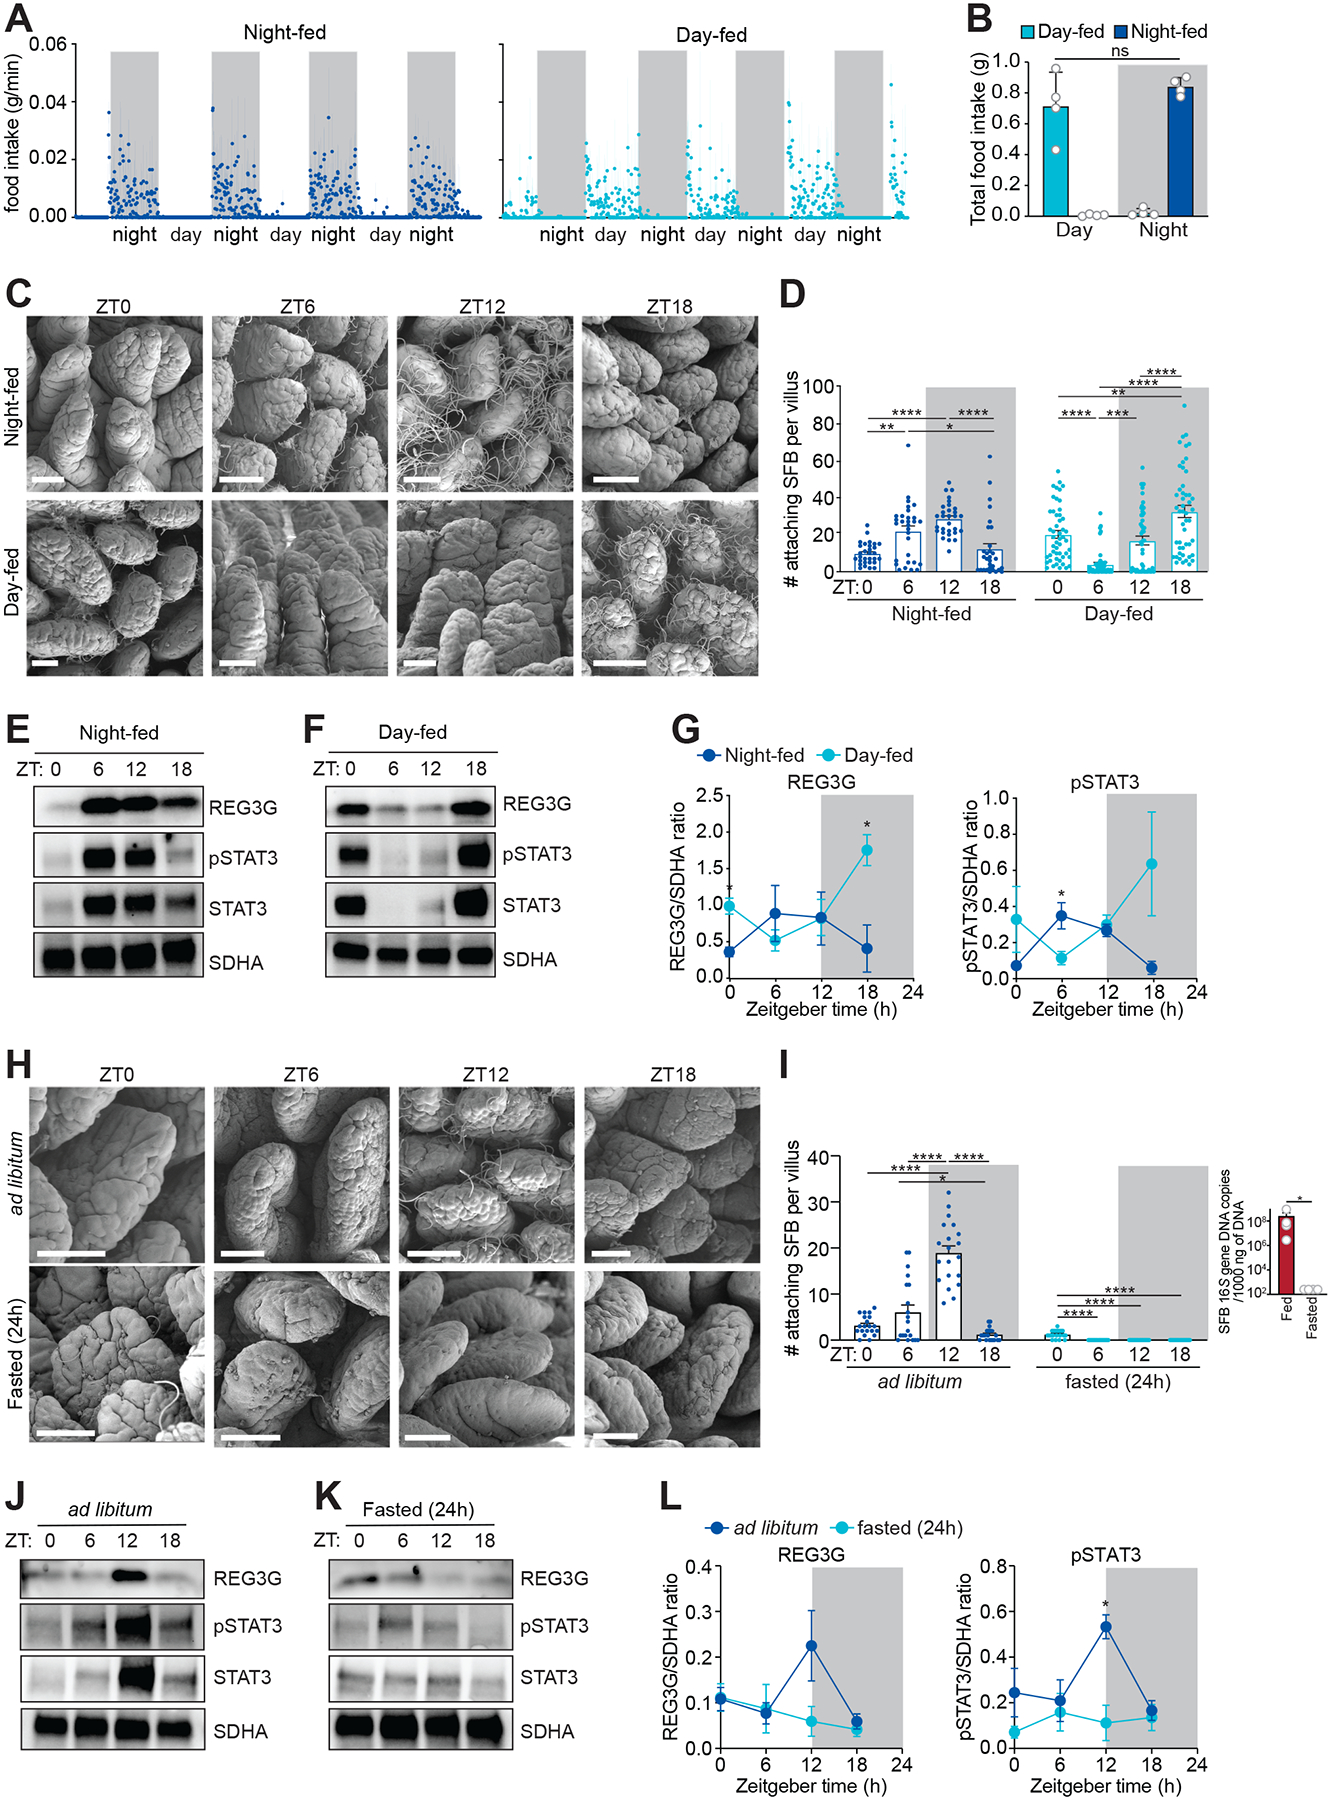
Figure 6. The circadian clock entrains host feeding rhythms that regulate rhythmic SFB attachment.

(A and B) Measurement of food intake rate in day- or night-fed mice (A). Total food intake during day and night (B). Each data point represents one mouse. n=4 mice per group.
(C and D) Scanning electron microscopy of intestinal epithelium from day- or night-fed mice (C). Scale bars, 50 μm. Enumeration of attaching bacteria (D). Attaching bacteria were counted as described in Figure 2E. n=3–5 mice per group.
(E-G) Representative immunoblots of small intestines from night-fed (E) or day-fed (F) mice, with detection of REG3G, STAT3, pSTAT3, and SDHA (control). Band intensities were quantified by densitometry (G). n=4 independent experiments.
(H and I) Scanning electron microscopy of intestinal epithelium from ad libitum fed or fasted (24 h) mice (H). Scale bars, 50 μm. Enumeration of attaching bacteria (I). The point of bacterial attachment was counted for 5 randomly selected villi across two visual fields per mouse. n=3–5 mice per group. Overall SFB abundance (I, right panel) was measured by Q-PCR analysis of 16S rRNA gene copy number in the ileum.
(J and K) Representative immunoblot of small intestines from ad libitum fed or fasted (24 h) mice, with detection of REG3G, STAT3, pSTAT3, and SDHA (control) (F). Band intensities were quantified by densitometry (G). n=4 independent experiments.
ZT, Zeitgeber time. Means ± SEM are plotted. *p < 0.05, **p < 0.01, ****p < 0.0001, ns, not significant by Student’s t test or one-way ANOVA. See also Figure S7 and Table S1.
