
Figure 7. SFB acts through STAT3 to cause diurnal variation in resistance to Salmonella infection.
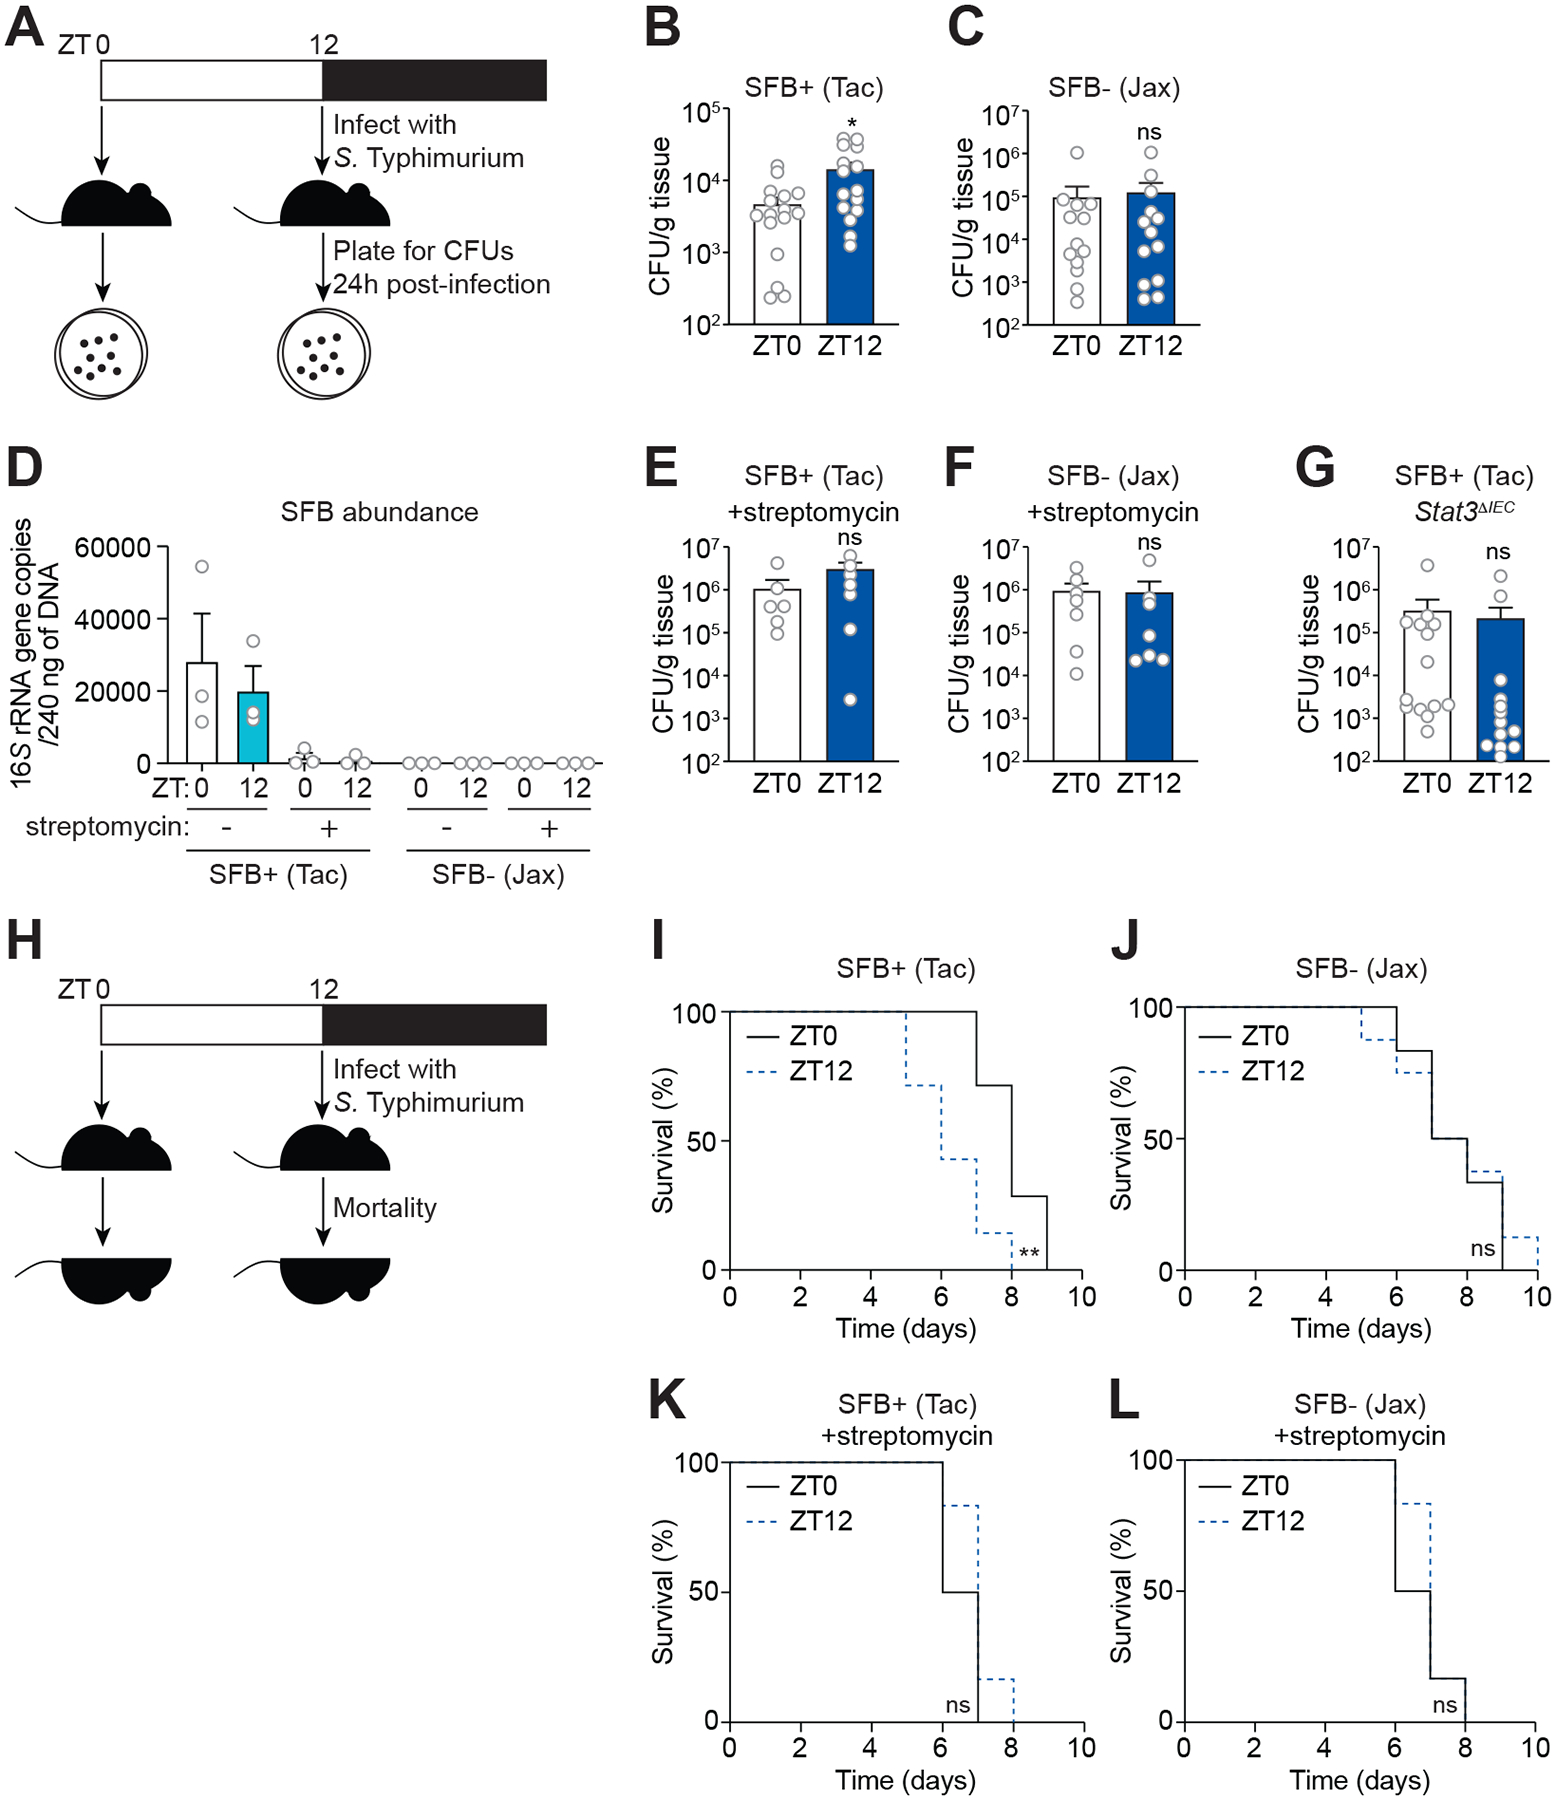
(A) Oral infection of mice with S. Typhimurium for determination of bacterial burden.
(B and C) Bacterial burdens in the ileum of wild-type SFB+ (Tac) mice (B) and SFB− (Jax) mice (C) infected with S. Typhimurium (108 CFU per animal). Each data point represents one mouse. n=13–16 mice per group.
(D) Q-PCR analysis of SFB abundance from fecal material derived from SFB+ (Tac) mice and SFB− (Jackson) mice at two timepoints (ZT0 and ZT12) before and after treatment with streptomycin.
(E and F) Bacterial burdens in the ileum of wild-type SFB+ (Tac) mice (E), SFB− (Jax) mice (F) infected with S. Typhimurium (108 CFU per animal) 24 hours after streptomycin administration. Each data point represents one mouse. n=6–7 mice per group.
(G) Bacterial burdens in the ileum of Stat3ΔIEC mice infected with S. Typhimurium (108 CFU per animal). Each data point represents one mouse. n=13–14 mice per group.
(H) Oral infection of mice with S. Typhimurium for determination of lethal morbidity rates.
(I and J) Lethal morbidity in wild-type SFB+ (Tac) mice (E) and SFB− (Jax) mice (F) infected with S. Typhimurium (107 CFU per animal). n=6–8 mice per group.
(K and L) Lethal morbidity in wild-type SFB+ (Tac) mice (E) and SFB− (Jax) mice (F) infected with S. Typhimurium (107 CFU per animal) 24 h after streptomycin administration. n=6–7 mice per group.
ZT, Zeitgeber time; SFB, segmented filamentous bacteria; Tac, Taconic; Jax, Jackson. Means ± SEM are plotted. *p < 0.05, **p < 0.01, ns, not significant by Student’s t test (Figures 7B–G) or log-rank (Mantel-Cox) test (Figures 7I–L). See also Table S1.