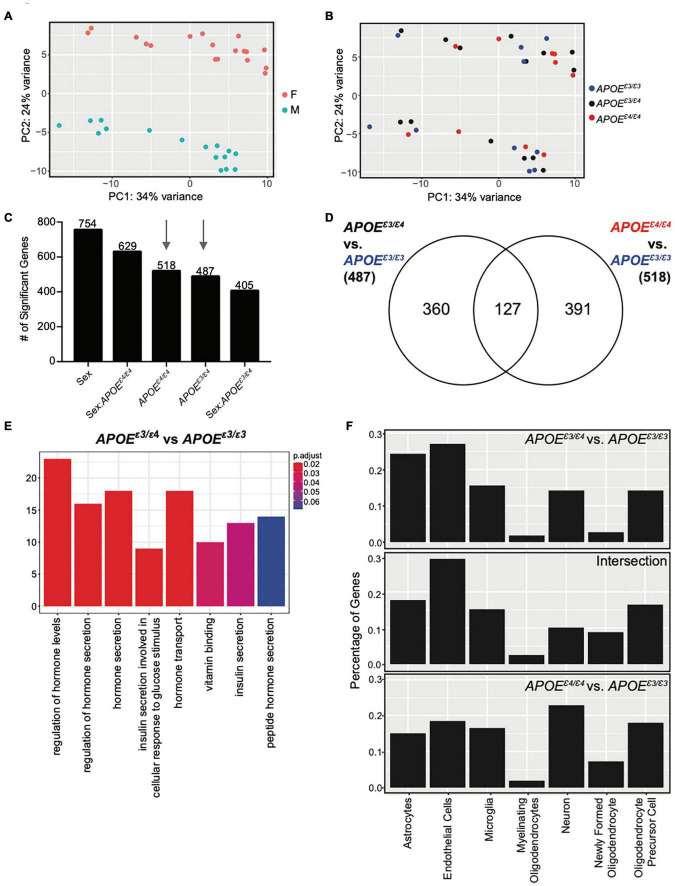
FIGURE 3.
Cortical transcriptome analysis revealed unique functional enrichment for the APOEε3/ε4 genotype at 2 months. (A) PCA showed distinct clusters of male and female samples. (B) PCA showed samples do not cluster by APOE genotype at two mos. (C) Number of significant genes for each linear model predictor term (p < 0.05). (D) Number of significant genes unique to 2-month APOEε4/ε4 and APOEε4/ε4 when compared to APOEε3/ε3, as well as the number of significant genes intersecting both lists. (E) Functional enrichment of the 360 significant genes (p < 0.10) unique to APOEε3/ε4 compared to APOEε3/ε3. (F) Percentage of genes expressed by cell type according to the BrainRNAseq dataset.

