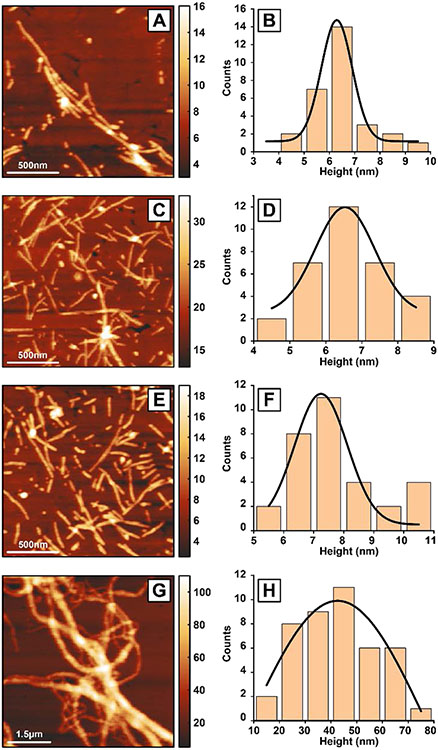
Figure 2: AFM imaging of tau fibrils.
Tau fibrils have been characterized at different time periods of 3 days (A-B), 5 days (C-D), 10 days (E-F) and 15 days (G-H). AFM topographic images of the fibrils for 3 days (A), 5 days (C), 10 days (E) and 15 days (G) show the fibril morphologies. The height values, as indicated by the color bars, are in nanometers. The height value of the fibrils was measured from several fibrils from each time periods of 3 days (B), 5 days (D), 10 days (F), 15 days (H) and plotted as a histogram. The distributions are fitted with a Gaussian to determine the peak height value in each case. The fibril height for 3 days, 5 days, 10 days and 15 days are 6.3±0.7 nm, 6.5±0.9 nm, 7.2±1.0 nm and 42.5±40.5 nm, respectively.

