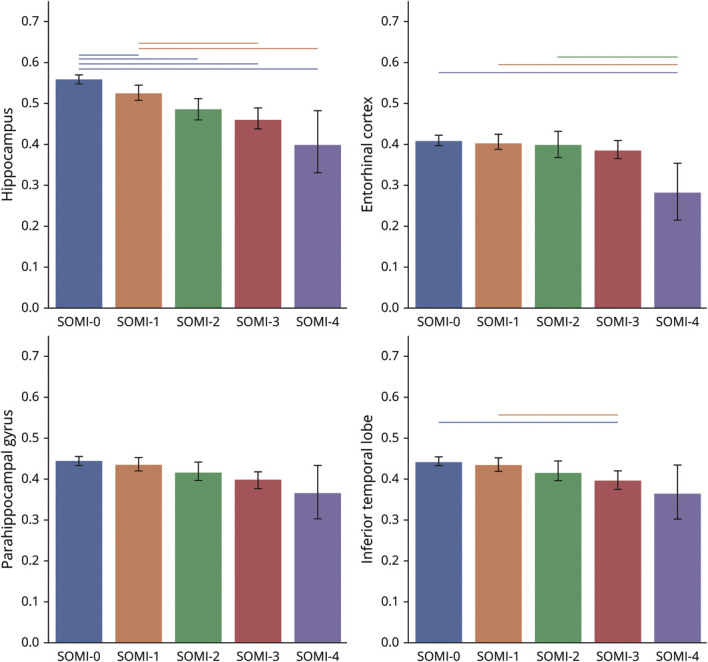
Figure 2. Volume of Different Regions by SOMI Stage.

Volumetric measures are normalized and rescaled to 0 to 1 to improve comparability. Groups significantly different from each other (p < 0.005) are connected to each other with lines. SOMI = Stages of Objective Memory Impairment.
