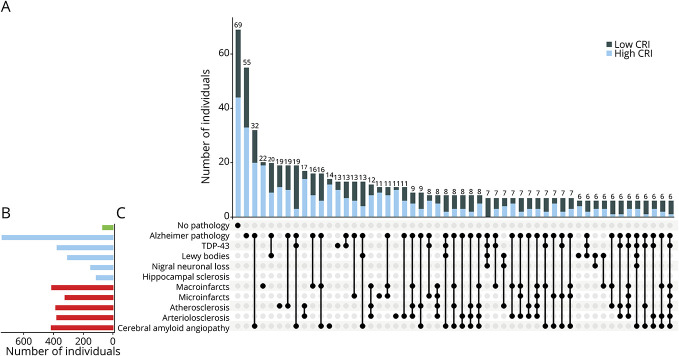
Figure 4. Burden of Brain Pathologies Is Lower in Individuals With High CRI Scores.
(A) Histograms in the main panel show the frequencies of the neuropathologic indices for participants with high cognitive resilience index (CRI) (graeater than median CRI, light blue) and participants with low CRI (less than median CRI, black). Bar chart (B) shows the frequencies of mixed-brain pathologies in the analytic cohort. (C) Connected black dots on the x-axis indicate the specific combination of neuropathologies represented. (A) Histograms in the main panel show the frequencies of the neuropathologic indices for participants with high cognitive resilience index (CRI) (greater than median CRI, light blue) and participants with low CRI (less than median CRI, black). As illustrated, brain neuropathologic indices frequently co-occur. Overall, fewer combinations of different brain pathologies are observed in individuals with high CRI. TDP-43 = TAR DNA-binding protein 43.

