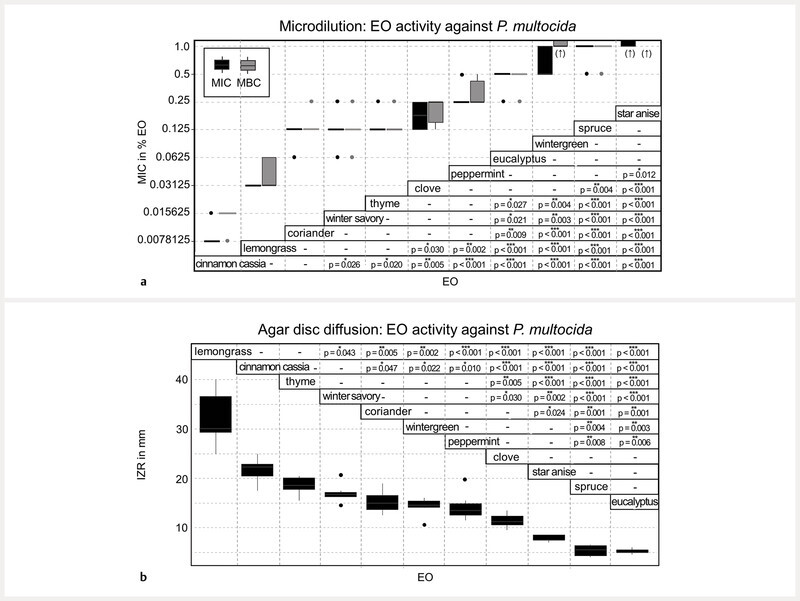
Fig. 1.

Depicted is ( a ) the minimum inhibitory and bactericidal concentration (MIC and MBC) in % of EOs and ( b ) the inhibition zone radius (IZR) in mm against P. multocida (n = 10). Statistically significant results of comparison of MICs or IZR of EOs are given. Conducted was a Kruskal-Wallis test (chi square = 100.94, df = 10, p < 0.001) and post hoc Dunn test with Benjamini-Hochberg adjustment for pairwise comparison. P values of statistically significant differences and indicating asterisks (*p value ≤ 0.05, **p value ≤ 0.01, ***p value ≤ 0.001, -not significant) are stated within the figure. (↑) MIC and MBC > 1%
