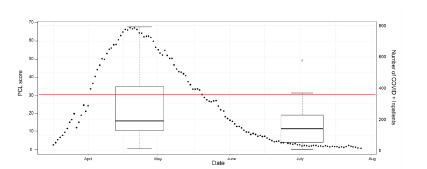
Figure 3.

Scatterplot of inpatient COVID-19 patients based on the corresponding dates (right side y axis) with box plot of PCL-5 score during the two survey periods, with box plot width corresponding to the survey administration period. A threshold at 31 is depicted for the PCL-5 score to demonstrate positive screening for PTSD symptoms
