Figure 1.
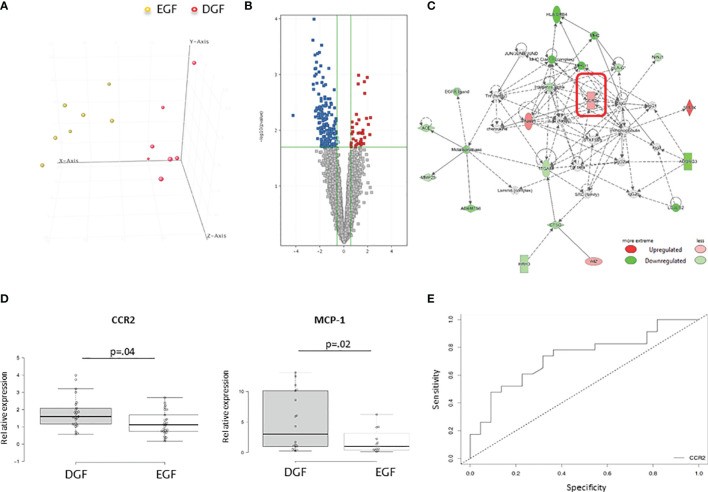
(A) Principal component analysis (PCA) of mRNAs discriminating DGF and EGF subjects. DGF (n = 7) and EGF (n = 7) patients are indicated in red and yellow, respectively. (B) Volcano plot of the 411 differentially expressed genes among DGF patients and EGF patients with a FDR <0.05 and a FC > 1.5. (C) Functional network of the differentially expressed genes among DGF patients and EGF controls. The most significant network is displayed graphically as nodes (genes) and edges (biological relationship between nodes). The node color intensity indicates the fold change of that gene’s expression. Shaded nodes are those genes identified by our microarray analysis, and empty nodes represent genes automatically included by IPA. The shapes of nodes indicate the functional class of the gene product, and the lines indicate the type of interaction. (D) Validation by quantitative real-time PCR of CCR2 and MCP-1 in PBMCs isolated from an independent group of 25 DGF and 25 EGF patients for CCR-2 gene expression and 11 DGF and 11 EGF for MCP-1 gene expression. Data are expressed as median and 25th and 75th percentiles in boxes and 5th and 95th percentiles as whiskers. (E) ROC curve analysis to evaluate the sensitivity and specificity of CCR2 as a predictive marker of DGF.

