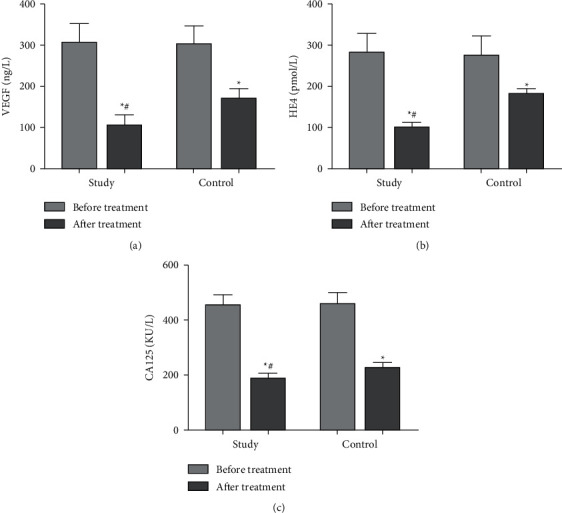
Figure 1.

Comparison of serum VEGF, HE4, and CA125 levels between the two groups. (a) The comparison of serum VEGF levels between the two groups before and after treatment. (b) The comparison of serum HE4 levels between the two groups before and after treatment. (c) The comparison of serum CA125 levels between the two groups before and after treatment.
