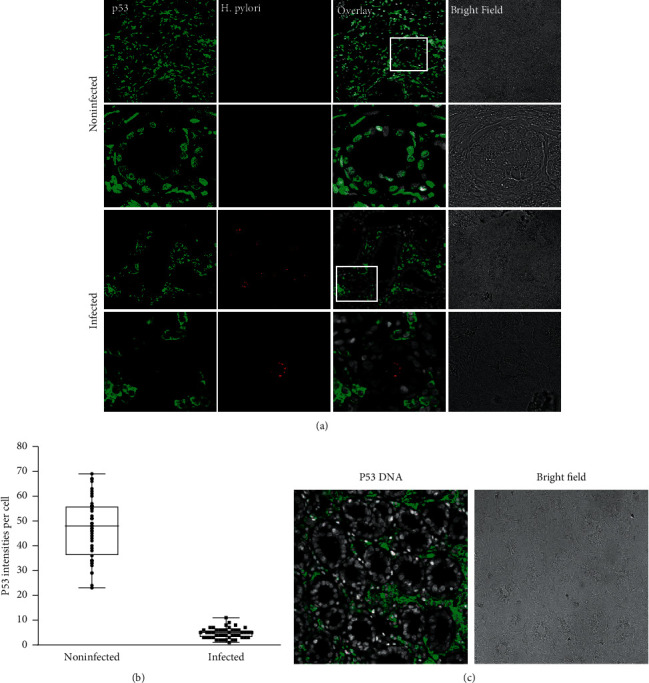
Figure 2.

p53 expression in H. pylori-infected and noninfected gastric glands. (a) Control gastric glands (no H. pylori infection) exhibiting a normal, wild-type pattern of p53 (green) expression in the epithelium and stroma, localized to the nuclei. p53 staining in gastric glands infected with H. pylori (red) exhibit a complete loss of nuclear p53 staining in the epithelium, while stromal cells display cytoplasmic staining for p53 (green). (b) Quantification of p53 intensities in gastric tissues revealing a significant decrease in p53 signal in epithelial cells infected with H. pylori compared to noninfected cells. Mean pixel intensities of p53 per nucleus were quantified from confocal images with ImageJ. Black bars indicate mean ± SD, ∗∗p < 0.01, as calculated by the t-test, n ≥ 47. (c) Stromal cells display cytoplasmic staining for p53 (green), while there is no p53 staining in the gastric epithelium.
