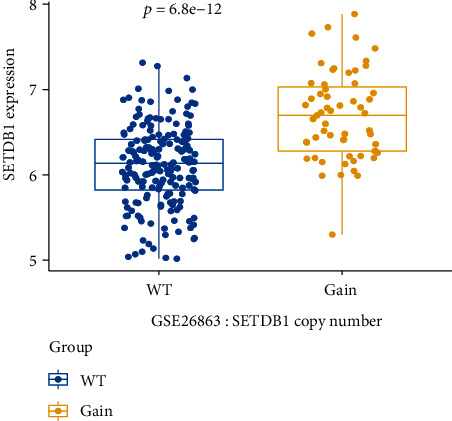
Figure 2.

SETDB1 copy number variation and mRNA level. Box plot based on the dataset GSE26863 shows that increased SETDB1 expression was the result of upregulated SETDB1 gene copy numbers (WT, n = 186, Gain, n = 159, p < 0.01, Wilcoxon test). The x-axis represents SETDB1 copy number gain or not, and the y-axis represents gene expression. SETDB1 gene expression was measured as log2.
