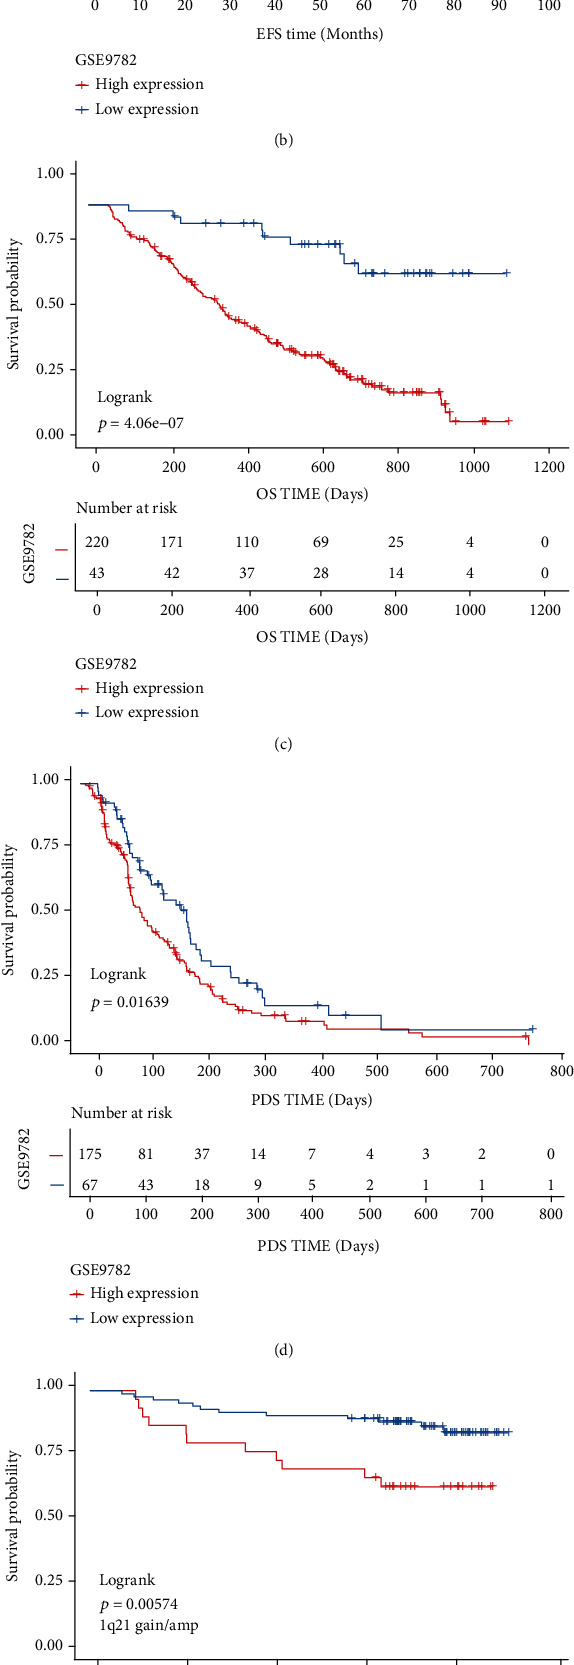
Figure 4.

Survival analysis of the SETDB1high and SETDB1low groups. (a and b) The Kaplan–Meier survival curves show that high SETDB1 expression predicts poor OS time and EFS time in MM sample from GSE24080 according to the SETDB1 optimal cut-off value (p < 0.01 and p < 0.01, respectively, log-rank test). (c and d) The Kaplan–Meier survival curves show that high SETDB1 expression predicts poor OS time and EFS time in the MM sample from GSE9782 according to the SETDB1 optimal cut-off value (p < 0.01 and p < 0.05, respectively, log-rank test). (e and f) The Kaplan-Meier analysis on the overall survival of MM patients from GSE2658 with and without 1q21 gain/amplification group (p < 0.01 and p < 0.01, respectively, log-rank test). The x-axis represents time, and the y-axis represents survival probability.
