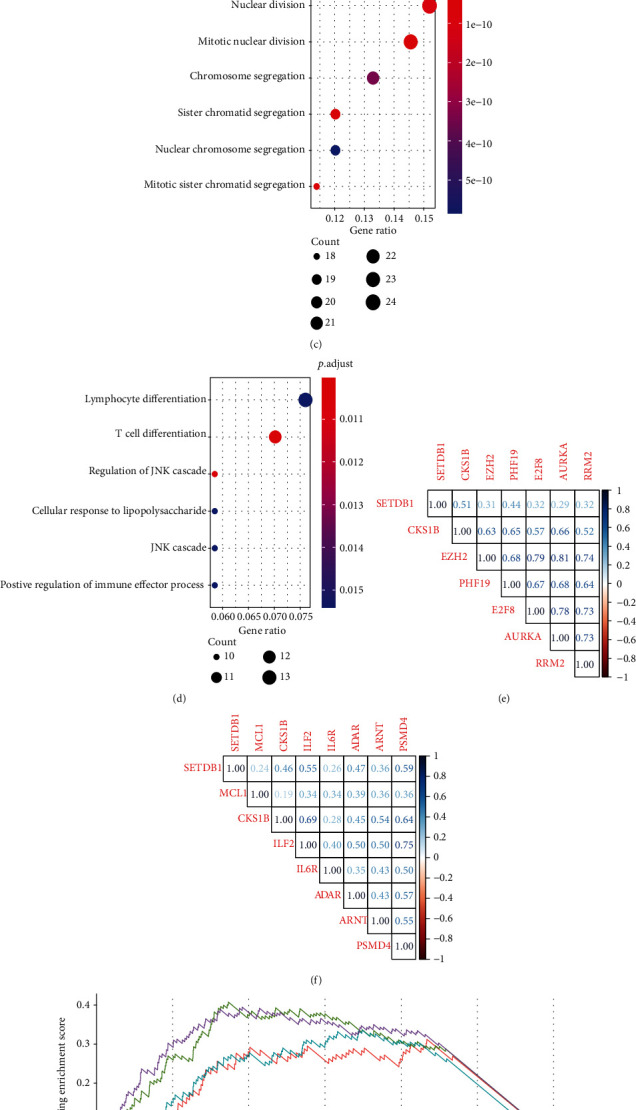
Figure 5.

Different expression genes (DEGs) and functional enrichment analysis. (a) Volcano plot of the DEG expression between SETDB1high and SETDB1low from GSE136337. The y-axis displays the -log10 adjusted p value for each gene, while the x-axis displays the log2 fold change for that gene relative to SETDB1 expression. (b) KEGG results for upregulated genes. (c) GO results for upregulated genes. (d) GO results for downregulated genes. (e) The correlation coefficient between SETDB1 and CKS1B, EZH2, PHF19, E2F8, AURKA, and RRM2. (f) The correlation coefficient between SETDB1 and MCL1, CKS1B, ILF2, IL6R, ADAR, ARNT, and PSMD4. (g) GSEA analysis shows that many genes positively correlated with SETDB1 are involved in four different pathways.
