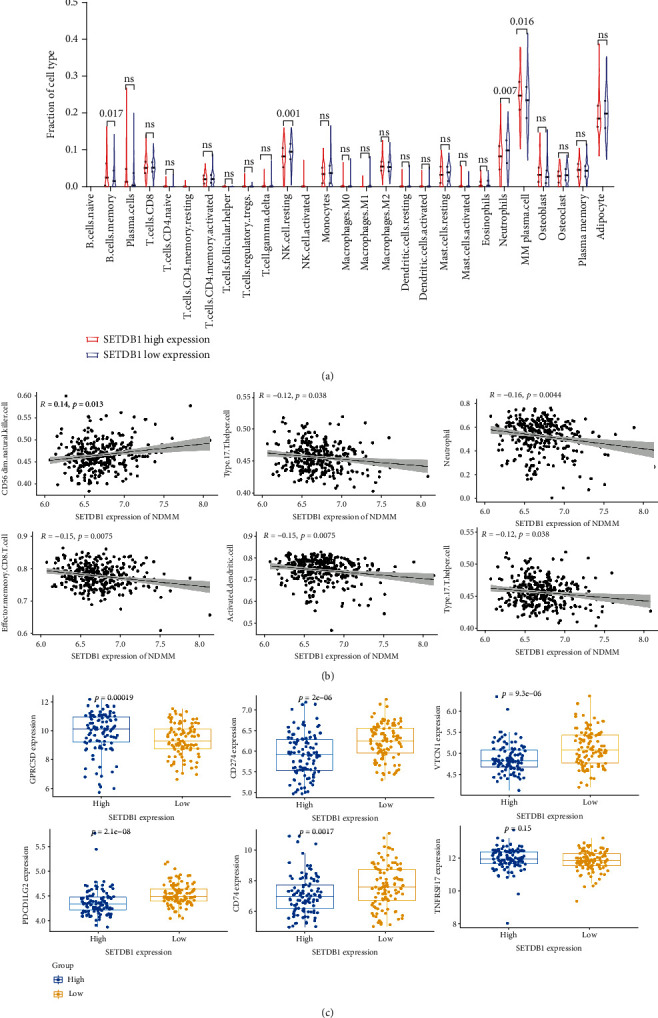
Figure 6.

The association of SETDB1 expression of myeloma cells and immune cell infiltration levels. (a) The Violin plot showed the proportion of 27 kinds of cell types in the high (n = 104) and low (n = 222) SETDB1 expression groups in MM samples. (b) The Scatter plot showed the associations between SETDB1 mRNA levels and infiltrations of immune cells in multiple myeloma WBM biopsies. (c) The Boxplot showed the distribution of immune checkpoint markers between the high- and low-expression of SETDB1 in myeloma samples. p < 0.05 as statistically significant. GPRC5D: G protein-coupled receptor class C group 5 member D; CD274: Programmed Cell Death 1 Ligand 1; VTCN1: V-Set Domain-Containing T Cell Activation Inhibitor 1; PDCD1LG2: Programmed Cell Death 1 Ligand 2; TNFRSF17: TNF Receptor Superfamily Member 17.
