Abstract
Growing concerns on free radicals are the oxidative processes associated with physiological damage. The consumption of functional foods and use of plants with antioxidant capacity are widespread. Given the importance of determining antioxidant capacity in relation to the therapeutic effect, this study was aimed at evaluating cinnamon extract (Cinnamomum sp.) in commercial samples by spectrophotometric and voltammetric methods and assessing the vascular activity of some samples. The spectrophotometric methods performed were DPPH (1,1-diphenyl-2-picrihydrazine), ABTS (2,21-azinobis-(3-ethylbenzothiazoline-6-sulfonic acid)), and Folin-Ciocalteu radical sequestration assays. For the electrochemical experiments, a three-electrode system was used, consisting of carbon paste electrode, platinum wire, and Ag/AgCl/KClsat, representing the working, auxiliary, and reference electrodes, respectively. The electroanalytical methods used were differential pulse, square wave, and cyclic voltammetries. The extracts were prepared in hydroalcoholic solution. A calibration curve with gallic acid was calculated to quantify their equivalent amounts in the analyzed extract. The correlation between the electrochemical approach and the total phenols calculated by the ABTS, DPPH, and Folin-Ciocalteu methods was 0.63, 0.7, and 0.73, respectively, with 1 being an ideal directly proportional correlation. The correlation between spectrophotometric methods was 0.83. A biosensor was developed in a carbon paste electrode using the enzyme laccase, obtained by the fungus Marasmiellus colocasiae. It was observed that the antioxidant profile of the cinnamon samples had an analytical sign improvement of up to 4 times when compared with the electrode without the modification. The samples were analyzed by mass spectrometer, and the main chemical markers found were coumarin, cinnamaldehyde, and eugenol. Pharmacological trials showed that these samples also induce a significant vasorelaxant effect associated to antioxidant potential on vascular injury induced by oxidative stress. Thus, cinnamon showed a high antioxidant capacity, in agreement with the results obtained in other studies, emphasizing its importance as a functional food.
1. Introduction
Reactive oxygen species (ROS) are highly reactive compounds formed from successive reductions of O2 present in the body's natural physiological functions such as regulation of cell growth, energy production, and phagocytosis [1]. This group includes the hydroxyl radical (•OH), superoxide anion (O2•-), and hydrogen peroxide (H2O2) that in excess in the body are related to several health prejudice, such as degenerative diseases, lipid peroxidation and damage in enzymes, proteins, carbohydrates, and DNA [2–4]. Moreover, up to 70% of the ROS produced can be transformed to reactive chlorine species such as hypochlorous acid (HOCl) and hypochlorite (OCl−) in the vasculature through the action of some enzymes (vascular peroxidase 1 and myeloperoxidase), leading to greater injuries in the cardiovascular system [5, 6].
A strategy for decreasing ROS in the body is the intake of antioxidants that are compounds capable of preventing oxidative degradation reactions through the stabilization of radical compounds [7]. The addition of antioxidants from natural origin in food products has become increasingly popular due to its importance in improving nutritional conservation and the quality of life for consumers [8, 9].
Cinnamon species belongs to the Lauracea family group that has eugenol and coumarins in their composition, which are phenolic compounds with high antioxidant power. Moreover, it also has proven antimicrobial activity due to the components cinnamaldehyde, cinnamic acid, aromatic aldehyde, benzoic acid, and benzaldehyde present in its structure [10–13].
The antioxidant capacity of natural products, whether of extract or isolated compound, is traditionally analyzed by spectrophotometric methods such as the radical 1,1-diphenyl-1-picryl-hydrazil (DPPH), the radical 2,2′-azinobis-(3-ethylbenzothiazoline-6-sulfonic acid) (ABTS), and Folin-Ciocalteu, which relate the discoloration of radicals with the antioxidant power of the analyzed product [14–17].
Although colorimetric methods are well established in the literature, they have several limitations, mainly related to interferences of molecules that absorb in the same range. In addition, there is a need for efficient prepreparation of the samples, since factors such as precipitation, suspension of large particles, and the opacity of the medium alter the absorbance reading [18, 19].
Comparatively, electroanalytical methods are a promising alternative for analyzing the antioxidant capacity of complex samples due to their high sensitivity, analysis speed, low cost, low reagent consumption, and generally nontoxicity. This technique is based on the correlation between the redox reaction of the antioxidant capacity and its detectable electrical properties [20, 21].
An alternative to improve the electrochemical results is the development of a biosensor, which uses biological reactions to detect specific components of a sample [22, 23]. A biosensor can be formed by an enzyme such as laccase that coupled to a transducer results in a signal proportional to the concentration of the analyte investigated [24–26].
Given the importance of determining antioxidant capacity in relation to the therapeutic effect, this study was aimed at evaluating cinnamon extract (Cinnamomum sp.) in commercial samples by spectrophotometric and voltammetric methods.
2. Materials and Methods
2.1. Reagents and Natural Products
All electrolyte solutions were used with analytical purity and were diluted in distilled Milli-Q water (conductivity ≤ 0.1 μS.cm−1) (Millipore S. A., Molsheim, France). Gallic acid, ethanol, and the standards of DPPH, ABTS, and Folin-Ciocalteu were purchased from Sigma-Aldrich Chemical Co. (St. Louis, MO, USA).
Seventeen commercial samples of powdered cinnamon were acquired from local businesses in Brazil and other countries such as Costa Rica, Greece, Portugal, Spain, and the United States of America.
2.2. Sample Preparation
Extraction fractions were prepared with 100 mg of the commercial samples of powdered cinnamon and 10 mL of different proportions of water and ethanol, being 100 : 0, 70 : 30, 50 : 50, 30 : 70, and 0 : 100 (water/ethanol), respectively. The samples were vortexed for 1 min, followed by 10 min in ultrasound and 5 min in centrifugation at 2500 rpm.
In order to avoid the presence of ethanol in the pharmacological assays (which could damage the vascular tissues), the samples 7 and 15 were lyophilized and resuspended in distilled water (100 mg/mL). Lyophilization was performed in a 25 L Genesis SQ Super XL-70 lyophilizer from SP Científica. For the procedure, the sample was frozen at -60 degrees at a pressure of 380 Torr (0.5 bar). After the sample was completely frozen, the pressure was reduced to 100 mTorr (0.0001333 bar) and held at that pressure and temperature for 72 h. Then, the temperature was increased to -10 degrees, keeping the same pressure and temperature for 72 h.
2.3. Electroanalytical Tests
The voltammetric experiments were performed in μAutolab III® potentiostat/galvanostat integrated with NOVA 2.1 software (Metrohm). The measurements were made in a 5 mL single compartment electrochemical cell with a 3-electrode system, consisting of a carbon paste electrode, an Ag/AgCl/KClsat 3 M electrode, and a platinum wire (purchased from Lab Solutions, São Paulo, Brazil), representing the working, reference, and auxiliary electrode, respectively. The experimental conditions for DPV were pulse amplitude of 50 mV, pulse width of 0.5 s, and scan rate of 10 mV.s−1. The experimental conditions for the SWV were pulse amplitude of 50 mV with a frequency of 50 Hz and a potential increase of 2 mV, corresponding to a scanning rate of 100 mV.s−1. The experimental conditions for CV were scan range from 0 to 1 and scan rate of 100 mV.s−1. The DPV voltammograms were corrected with the baseline-corrected, and all data were analyzed and treated in the Origin 9.0 software.
All experiments were done at room temperature (21 ± 1°C) in triplicate (n = 3), and the main electrolyte used was 0.1 M phosphate buffer (PB) pH 7.0.
2.4. Electrochemical Index
The electrochemical index (EI) takes into account major voltammetric parameters, such as anodic peak potential (Epa) and anodic peak current (Ipa). Based on the fact that in lower Epa, the electron donation ability is greater (thermodynamic parameter) and the higher the Ipa (kinetic parameter), the greater the number of electroactive species, EI is calculated using the following:
| (1) |
where in a voltammogram with n peaks, Ipan and Epan are the current and the potential of the n peak, respectively.
2.5. Biosensor
The fungus Marasmiellus colocasiae CCIBT 3388, isolated in Domingos Martins-ES/2005, was obtained from the Basidiomycete Culture Collection (CCB) of the São Paulo Institute of Botany. The identification of the obtaining source ex situ of genetic heritage, with the information contained in the records, is in accordance with § 1 of the Article 22 of the Decree No. 8.772 of 2016. The crude enzymatic extract from Marasmiellus colocasiae, developed as described in previous work of our research group [27], was used to prepare the optimized biosensor.
Briefly, 50 μL of enzymatic crude extract was mixed with 70 mg of graphite (Sigma-Aldrich®) and left to dry at room temperature for 1 h. Then, 30 mg of mineral oil, the agglutinating agent, was added and rigorously mixed in order to achieve a homogenous paste. This final paste was used to fill the cavity of the electrode that was 2 mm in diameter and 0.5 mm in depth. The experimental conditions for DPV were pulse amplitude of 50 mV, pulse width 0.5 s, scan rate of 10 mV.s−1, and scan range from 1 to 0 V. All experiments were done at room temperature (21 ± 1°C) in triplicate, and the main electrolyte used was 0.1 M sodium acetate buffer, pH 5.0.
2.6. DPPH Radical Scavenging Assay
The radical scavenging activity was done using the DPPH reagent, according to the well-established procedures [24]. A mixture of 2.7 mL of DPPH ethanolic solution (0.1 mM) and 0.3 mL of ethanol was prepared as a blank control, where the final absorbance at 517 nm was a.c. 0.7. Ethanol was used to adjust the baseline (A = 0.00).
For the experiments, 300 μL of ethanolic portion was replaced by the extract and by the standards when the calibration curve was performed. The measurements were analyzed using UV-vis spectrometer (model V-530, Jasco, Inc., Easton, MD, USA). Each trial was performed in triplicate. The antioxidant activity was expressed as IC50 as indicated in Equation (2), where 50% of the sample solution is capable of producing discoloration compared to the white control (ethanol) after five min of transferring the sample aliquot to the DPPH radical. The samples were analyzed in a 1 cm optical path cuvette at room temperature.
| (2) |
where % AA is the percentage of antioxidant activity and ADPPH is the absorbance of the solution with the radical formed without the presence of a sample. Atest is the absorbance observed in the presence of the radical with the analyte, and IC50 is the amount of extract in g/mL of the tested samples needed to decrease the initial ABTS concentration by 50%.
Linearity was observed in the calibration curves of gallic acid with the regression equation.
2.7. ABTS Radical Scavenging Assay
The ABTS radical assay was conducted according to literature [20], formed from the reaction of 5.0 mL of ABTS solution in water (7 mM) with 88 μL of potassium persulfate solution in water (140 mM), and incubated in the absence of light for 16 hours. Then, 2 mL of the prepared radical solution was diluted in ethanol to 150 mL, obtaining a solution with an absorbance a.c. 0.7 at a wavelength of 734 nm.
For the experiments, 300 μL of the ethanol extract was added to the test tube containing 2.7 mL of ABTS radical; thus, the tubes were covered with Parafilm® and kept in the dark for 20 min. The absorbance was monitored with the same spectrophotometer used for DPPH assay. All tests were performed in triplicate. The decay percentage expressed by absorbance at 734 nm was calculated as
| (3) |
where % AA is the percentage of antioxidant activity and AABTS is the absorbance of the solution with the radical formed without the presence of a sample. Atest is the absorbance observed in the presence of the radical with the analyte, and IC50 is the amount of extract in g/mL of the tested samples needed to decrease the initial ABTS concentration by 50%.
Linearity was observed in the calibration curves of gallic acid with the regression equation.
2.8. Total Phenolic Assay
The total phenolic compounds were determined by Folin-Ciocalteu (FC) spectrophotometric method. Cinnamon samples at a concentration of 1% were prepared, and aliquot of 50 μL of the extract was added in a test tube containing 1 mL of distilled water and 250 μL of the FC reagent. After 5 min, 750 μL of a 20% Na2CO3 solution and 2950 μL of distilled water were added. The mixture was incubated in the absence of light for 60 min, obtaining absorbance of a.c. 0.7 at a wavelength of 765 nm. The quantification of phenolic compounds in cinnamon samples was carried out in triplicate and expressed by means of gallic acid equivalents in μM, from a calibration curve obtained under the same conditions for sample analysis [28, 29].
2.9. Mass Spectrometry Analysis
A metabolic assessment of cinnamon samples was performed by direct injection of untreated samples into a mass spectrometry system. The samples were dissolved in methanol at concentration of 500 ppm, filled into a 500 μL syringe (Hamilton) and infused directly using a syringe pump at a flow rate of 3 μL/min, and analyzed on an Q-Exactive Orbitrap (Thermo Scientific, Bremen, Germany) equipped with an electrospray ionization (ESI) source. The analyses were performed in negative (ESI (-)-MS) and positive (ESI (+)-MS) mode and mass range of 100-1000 Da. The identification of the main metabolites detected in the cinnamon samples was performed using online dereplication platforms (MetFrag, PubChem, and CFM-ID).
2.10. Studies in Isolated Arteries
Male Wistar rats (7-8 weeks old, 210–240 g) from the Central Bioterium of the Federal University of Goiás were used in this protocol. All experiments were carried out in agreement with the Brazilian Society of Laboratory Animal Science and were approved by the Local Ethics in Research Committee (Protocol CEUA/UFG 116/19). The rats (n = 5 − 7 for each different protocol) were anaesthetized and killed (cardiac puncture and exsanguinations), and the thoracic aorta was removed, cleaned and cut into rings (±3-4 mm in length), placed in an organ bath (10 mL) between two stainless-steel stirrups, and connected to a computerized system and a WinDaq Resource (DATAQ Instruments, Akron, OH, USA) data acquisition unit to measure vascular isometric tension. The isolated vascular chamber was completed with physiological salt solution with the following composition: 130 mM NaCl, 1.2 mM KH2PO4, 4.7 mM KCl, 14.9 mM NaHCO3, 1.2 mM MgSO4, 1.6 mM CaCl2 and 5.5 mM glucose, at pH 7.4, and gassed with carbogenic gas (95% O2 and 5% CO2) at 37°C.
The vascular rings were firstly stretched to a basal tone of 1.5 g before allowing them to equilibrate in the bathing solution. The endothelial cell integrity was demonstrated by the presence of relaxation (minimum 80% of relaxation) to acetylcholine (1 μM) after being precontracted with phenylephrine (0.1 μM). After equilibration, cumulative concentration-response curves for the cinnamon samples (0–380 μg/mL, lyophilized and diluted in distilled water) were generated using isolated aortic rings with functional endothelium that had been precontracted with phenylephrine (0.1 μM). For the vascular studies, only the cinnamon samples that showed the best and the worst antioxidant activity were used (samples 7 and 15, respectively). Furthermore, in order to verify the relative contribution of endothelium nitric oxide to the vascular relaxation induced by cinnamon samples, the same protocols were repeated after treatment (30 min) with nitric oxide synthase inhibitor (L-NAME, 100 μM).
In other series of experiments, the vascular contraction induced by adrenergic agonist (phenylephrine, 0.1 μM) was investigated in control vessels or after oxidative stress stimulus characterized by the addition of hypochlorite (OCl−) in the bath solution at concentration of 5 μM (60 min) [6, 30]. After 60 min, the arteries with intact endothelium were contracted again with phenylephrine (0.1 μM), and the level of contraction was measured. In addition, some arteries were treated with cinnamon samples (samples 7 and 15) in two different concentrations (100 and 500 μg/mL) at the same time as the oxidative stress stimulus with OCl− (treatment with 5 μM OCl− plus cinnamon samples for 60 min).
2.11. Statistical Analysis
For the electrochemical and radical scavenging assay data analysis, the Origin 9.0 statistical software was used. A correlation matrix was performed for the antioxidant parameters evaluated, i.e., ABTS, DPPH, Folin-Ciocalteu, and EI. ANOVA analysis was performed for the unmodified and modified electrode assays with the null hypothesis of equal averages and 0.05 of significant value.
In the vascular studies, values were expressed as mean ± SEM. Comparisons among groups were performed using one-way ANOVA (posttest: Newman–Keuls) with 0.05 of significant value. Analyses were carried out using GraphPad Prism version 5.00 for Windows (San Diego, CA, USA).
3. Results and Discussion
3.1. Solvent Extraction
Cinnamon is constituted by several components of different polarities [31]; for this reason, water and ethanol were evaluated to investigate the effectiveness of cinnamon extraction using a pool of all samples. Extractions were analyzed through the EI (μA/V) of the cinnamon for each solvent (Table 1).
Table 1.
Solvents for cinnamon extraction.
| W/E | 100 : 0 (v/v) | 70 : 30 (v/v) | 50 : 50 (v/v) | 30 : 70 (v/v) | 0 : 100 (v/v) |
|---|---|---|---|---|---|
| EI (μA/V)∗ | 38.62 ± 28.4 | 50.17 ± 5.9 | 45.64 ± 46.5 | 57.33 ± 4.6 | 59.24 ± 24.2 |
W: percentage of water/E: percentage of ethanol. ∗Median values ± RSD.
Samples with higher concentration of ethanol demonstrated better extraction than aqueous solution because ethanol can be considered a bipolar solvent that dissolves most slightly nonpolar and polar organic compounds that make up most of the molecules with antioxidant action [32].
The result obtained in this work corroborates with the literature that describes a better cinnamon extraction with a combination of both solvents than when used separately [33]. The solvents of water/ethanol in the proportions of 70 : 30 (v/v), 30 : 70 (v/v), and 0 : 100 (v/v) presented EI higher than 50 μA/V without significant statistical differences. Therefore, the solvent water/ethanol 30 : 70 (v/v) was chosen for the further experiments.
3.1.1. Cinnamon Characterization
In order to evaluate the redox profile of Cinnamon samples, electrochemical experiments were performed with a pool of all samples. The electrolytic support was studied from pH 3.0 to pH 9.0 (Figure 1). This is an important parameter to be evaluated, once it allows the electron flow for the passage of current in the reaction medium [34].
Figure 1.
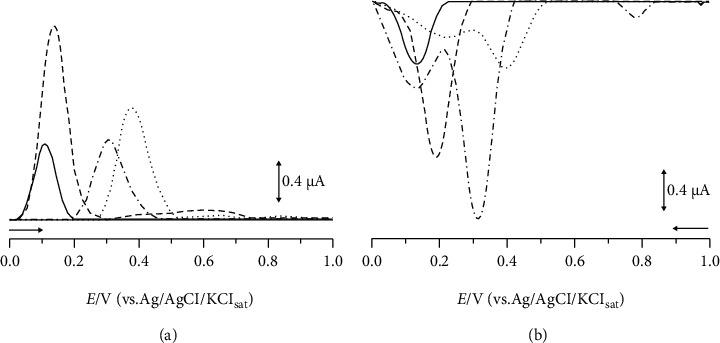
DP voltammograms of different pHs obtained for nonmodified carbon paste electrode in 0.1 M phosphate buffer (a) and biosensor with 0.1 M sodium acetate buffer (b) for cinnamon. For pH 9.0 (––––), pH 7.0 (– – –), pH 5.0 (– - –), and pH 3.0 (......).
The nonmodified carbon paste electrode presented a better resolution and sensitivity in the pH 7.0, in agreement with Souza-Sartori [35], which demonstrated that phenolic compounds are better solubilized in a pH range of extraction between 6.0 and 8.0. For the modified electrode with the laccase enzyme obtained from the fungus Marasmiellus colocasiae, the signal increased in the pH 5.0. According to literature, laccase enzyme is often used in pH conditions ranging from 3.5 to 5.5 [36, 37]. Therefore, these electrolytic supports were used in the further analysis.
Figure 2 shows the voltammetry profiles of commercial cinnamon samples.
Figure 2.
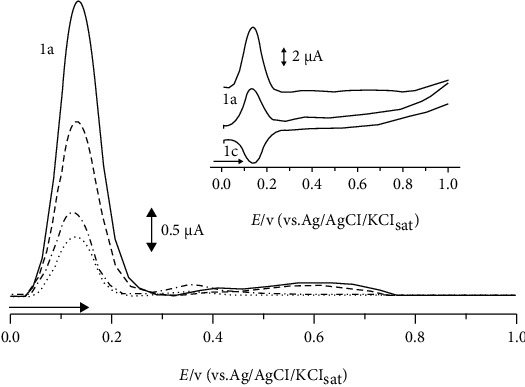
Differential pulse voltammetry (DPV). Inset: square wave voltammetry (SWV) of cinnamon commercial samples (0.01%). Samples A (––––), B (– – –), and C (– - –) and second scans (.......).
Among the evaluated samples, a similar profile was observed, where an anodic peak c.a.Epa1 = 0.1 V was present. Anodic peaks in potentials c.a.Epa1 = 0.2 V or in lower values are indicative of polyphenol compounds [38]. Due to the low overpotential values seen in this compounds' oxidation process, it can be inferred that these compounds have high antioxidant capacity and the same can be said about the other samples [24].
The intensity of the peak varied in a decreasing order from samples A, B, and C. These samples were chosen because they represent the highest, median, and lowest results of EI, originated from Paraná (BRA), Goiás (BRA), and Lisboa (PRT), respectively. Since the intensity of the anodic peak is correlated with the concentration of the sample by the Cottrell equation [39], sample A likely has the highest amount of antioxidant compounds and sample C likely has the lowest amount.
The reversibility of the anodic peak c.a.Epa1 = 0.1 V was also observed for all sample analysis, corroborating the presence of polyphenol compounds in these samples. Moreover, samples A and B presented a second slight anodic peak c.a.Epa2 = 0.6 V and sample C in c.a.Epa2 = 0.4 V; these anodic peaks can be correlated to other phenolic compounds present in lesser quantities [20, 40].
3.2. Antioxidant Capacity
The variables of antioxidant capacity were compared and evaluated by the spectrophotometric methods ABTS, DPPH, and Folin-Ciocalteu with electrochemical experiments through the EI values for all samples. A correlation matrix was calculated (Table 2).
Table 2.
DPPH, ABTS, Folin AG, and EI correlation matrix for cinnamon species.
| ABTS | DPPH | Folin AG | EI | |
|---|---|---|---|---|
| ABTS | 1 | 0.83 | 0.5 | 0.62 |
| DPPH | 0.83 | 1 | 0.62 | 0.7 |
| Folin AG | 0.5 | 0.62 | 1 | 0.73 |
| EI | 0.62 | 0.7 | 0.73 | 1 |
A high correlation coefficient of approximately 0.7 was seen between EI and DPPH/ABTS/Folin-Ciocalteu, which shows that despite the difference in methodologies, being the first electroanalytical and the latter scavenging, the inferences about the redox process of the antioxidant capacity are closely related. The EI correlation between modified and nonmodified electrodes was 0.62. Moreover, the correlation coefficient between ABTS and DPPH was also high (c.a. 0.8).
The total phenol of cinnamon was expressed by gallic acid equivalents. Hence, a calibration curve with concentrations from 4.97 μM to 166.66 μM for gallic acid was constructed in order to get the linear equation Y = 4.34e−7 + 1.20e−8X (intercept SD = 6.10e−23, slope SD = 5.68e−25), obtaining R2 = 0.99. The samples of cinnamon with greatest gallic acid quantity were samples 3 and 7, corresponding to 0.17 and 0.19AG (g/g ext), respectively (Table 3).
Table 3.
Percentage of decay for ABTS, DPPH, Folin, EI, and gallic acid equivalents for cinnamon species.
| Sample | ABTS (% of decay) | SD | DPPH (% of decay) | SD | Folin (% of increase) | SD | EI (μA/V) | SD | AG (g/g extract) | SD |
|---|---|---|---|---|---|---|---|---|---|---|
| 1 | 96.73 | 4.84 | 67.20 | 3.36 | 0.24 | 0.07 | 7.77 | 0.39 | 0.09 | 0.04 |
| 2 | 69.86 | 3.49 | 62.61 | 3.13 | 0.35 | 0.05 | 6.13 | 0.31 | 0.07 | 0.00 |
| 3 | 80.64 | 4.03 | 65.42 | 3.27 | 0.70 | 0.09 | 11.86 | 0.59 | 0.17 | 0.07 |
| 4 | 94.06 | 4.70 | 74.30 | 3.71 | 0.51 | 0.05 | 6.07 | 0.30 | 0.06 | 0.02 |
| 5 | 88.75 | 4.44 | 70.55 | 3.53 | 0.32 | 0.08 | 7.37 | 0.37 | 0.08 | 0.07 |
| 6 | 90.52 | 4.53 | 73.85 | 3.69 | 0.77 | 0.12 | 7.37 | 0.37 | 0.08 | 0.00 |
| 7 | 97.55 | 4.88 | 79.03 | 3.95 | 0.87 | 0.03 | 12.84 | 0.64 | 0.19 | 0.05 |
| 8 | 95.05 | 4.75 | 83.29 | 4.16 | 0.94 | 0.06 | 8.81 | 0.44 | 0.11 | 0.00 |
| 9 | 97.02 | 4.85 | 77.86 | 3.89 | 0.55 | 0.04 | 9.14 | 0.46 | 0.12 | 0.04 |
| 10 | 75.92 | 3.80 | 60.91 | 3.05 | 0.59 | 0.04 | 6.20 | 0.31 | 0.06 | 0.05 |
| 11 | 96.42 | 4.82 | 71.63 | 3.58 | 0.89 | 0.06 | 9.47 | 0.47 | 0.12 | 0.06 |
| 12 | 47.33 | 2.37 | 41.78 | 2.09 | 0.37 | 0.02 | 4.73 | 0.24 | 0.03 | 0.00 |
| 13 | 92.71 | 4.64 | 81.89 | 4.09 | 0.48 | 0.07 | 8.38 | 0.42 | 0.10 | 0.01 |
| 14 | 68.67 | 3.43 | 51.11 | 2.56 | 0.06 | 0.00 | 3.39 | 0.17 | 0.02 | 0.00 |
| 15 | 72.39 | 3.62 | 41.69 | 2.08 | 0.34 | 0.06 | 4.93 | 0.25 | 0.03 | 0.02 |
| 16 | 82.32 | 4.12 | 51.58 | 2.58 | 0.59 | 0.00 | 4.98 | 0.25 | 0.03 | 0.02 |
| 17 | 87.13 | 4.36 | 59.10 | 2.95 | 0.65 | 0.06 | 6.68 | 0.33 | 0.07 | 0.02 |
According to the Folin-Ciocalteu method, total phenols are more present in the cinnamon samples 7 and 8, which corroborates with the electrochemical studies that also showed a higher EI for the sample 7. Likewise, the results obtained for both methodologies also showed agreement for the sample with the lowest antioxidant capacity, represented by the cinnamon sample 14.
3.3. Biosensor
Table 4 shows the results obtained from the carbon paste electrode modification using the laccase enzyme of the fungus Marasmiellus colocasiae.
Table 4.
Antioxidant capacity of cinnamon samples using carbon paste modified electrode.
| Sample | Unmodified electrodes (μA) | SD | Modified electrodes (μA) | SD | Signal increase (modified signal/unmodified signal) | Signal increase (%) |
|---|---|---|---|---|---|---|
| 1 | -0.47 | 0.34 | -1.02 | 0.34 | 2.17 | 216.56 |
| 2 | -0.67 | 0.56 | -1.85 | 0.14 | 2.78 | 277.78 |
| 3 | -1.01 | 0.72 | -2.07 | 0.14 | 2.05 | 204.95 |
| 4 | -0.93 | 0.62 | -1.57 | 0.31 | 1.69 | 169.00 |
| 5 | -0.68 | 1.08 | -1.67 | 0.36 | 2.47 | 247.04 |
| 6 | -1.23 | 0.01 | -1.43 | 0.01 | 1.16 | 116.26 |
| 7 | -0.72 | 0.848 | -1.39 | 0.21 | 1.93 | 192.79 |
| 8 | -0.57 | 0.52 | -0.91 | 0.13 | 1.61 | 160.85 |
| 9 | -0.47 | 0.41 | -0.91 | 0.21 | 1.91 | 190.93 |
| 10 | -0.50 | 0.66 | -1.08 | 0.17 | 2.16 | 216.43 |
| 11 | -0.75 | 0.19 | -1.08 | 0.19 | 1.44 | 144.19 |
| 12 | -0.68 | 0.60 | -1.51 | 0.12 | 2.21 | 221.08 |
| 13 | -0.66 | 0.55 | -1.29 | 0.28 | 1.97 | 196.95 |
| 14 | -0.70 | 0.45 | -1.33 | 0.23 | 1.91 | 191.37 |
| 15 | -0.61 | 0.26 | -1.19 | 0.09 | 1.95 | 194.76 |
| 16 | -0.38 | 2.19 | -1.55 | 0.44 | 4.12 | 412.23 |
| 17 | -1.13 | 4.96 | -2.42 | 1.24 | 2.14 | 214.16 |
ANOVA test probability p = 6.12∗10−6 and F value = 38.41 shows that modified and unmodified values were statistically different.
The enzymatic biosensor of Marasmiellus colocasiae produces biochemical oxidation followed by an electrochemical reduction detected amperometrically that allows the detection of polyphenols. Thus, the modified electrode showed improvement in all samples, with a signal increase of up to 4 times, due to the laccase's ability to oxidize the phenolic compounds present in the cinnamon [41, 42].
Corroborating the spectrophotometric data of the Folin-Ciocalteu assay with the Marasmiellus colocasiae biosensor, the biosensor presented better results in 7 and 8, confirming the previous results in the other electrochemical and spectrophotometric methods, through the amplification of the signal promoted by the enzyme, used as an auxiliary electrochemical tool in the detection of phenolic compounds present in cinnamon [27].
3.4. Mass Spectrometry Analyses
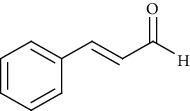
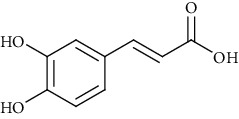
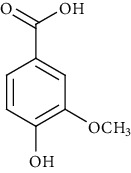
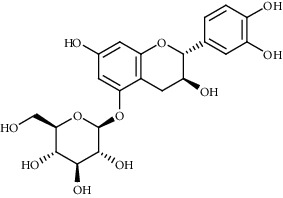
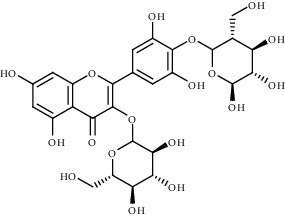
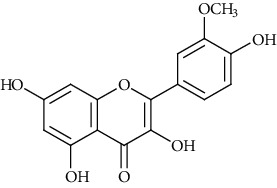
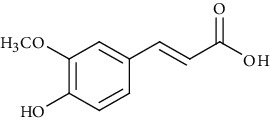
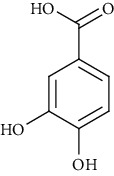
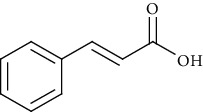
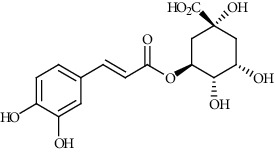
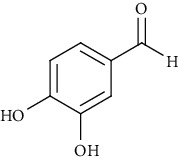
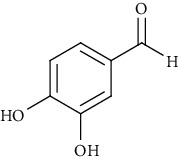
The purpose of this study was to annotate compounds that contribute to antioxidant potential from cinnamon samples based on their mass to charge ratios (m/z) and elemental composition obtained through Orbitrap mass analyzer, as well as chemotaxonomy data reported in literature. Hence, cinnamon samples were analyzed by high-resolution mass spectrometry (HRMS) in order to identify the main chemical markers and associate with their antioxidant activity. A wide range of phenolic compounds such as flavonoids, coumarin, phenolic acids, and cinnamic acid derivatives were annotated by MS analyses, which have recognized antioxidant activity [43]. Fifteen antioxidant compounds reported in cinnamon were annotated in the current study, conforming Table 5.
Table 5.
Metabolites present in cinnamon samples (Cinnamomum) with antioxidant property.
| Ion mode | m/z | Empirical formula | Compound name | Chemical structure | Reference |
|---|---|---|---|---|---|
| ESI(+)MS | 147.04 | C9H6O2 | Coumarin |

|
[44, 45] |
| ESI(+)MS | 133.06 | C9H8O | Cinnamaldehyde |
|
[46, 47] |
| ESI(+)MS | 181.07 | C9H8O4 | Caffeic acid |
|
[48] |
| ESI(+)MS | 169.05 | C8H8O4 | Vanillic acid |
|
[49] |
| ESI(+)MS | 453.17 | C21H24O11 | Catechin 3′-glucoside |
|
[50] |
| ESI(+)MS | 645.16 | C27H32O18 | Myricetin derivative |
|
[51] |
| ESI(+)MS | 317.21 | C16H12O7 | Isorhamnetin |
|
[50, 52] |
| ESI(+)MS | 369.24 | C21H20O6 | Curcumin |

|
[53] |
| ESI(-)MS | 165.06 | C10H12O2 | Eugenol |

|
[44, 54, 55] |
| ESI(-)MS | 195.05 | C10H10O4 | Ferulic acid |
|
[56, 57] |
| ESI(+)MS | 153.02 | C7H6O4 | Protocatechuic acid |
|
[56] |
| ESI(-)MS | 191.06 | C11H12O3 | Coumaryl acetate |
|
[58] |
| ESI(-)MS | 147.04 | C9H8O2 | Cinnamic acid |
|
[59] |
| ESI(-)MS | 353.09 | C16H18O9 | Chlorogenic acid |
|
[60] |
| ESI(-)MS | 137.02 | C7H6O3 | 3,4-Dihydroxybenzaldehyde |
|
[60] |
The major peak in terms of % area peak from the cinnamon samples belonged to coumarin at m/z 147.04. The applied spectrometric study allowed inferring the substances responsible for antioxidant potential from cinnamon samples. Therefore, mass spectrometry is a rapid and sensitive technique that can be applied to the identification of bioactive compounds in cinnamon samples.
In Figure 3, it is possible to identify the chemical markers from the cinnamon samples, which are the compounds coumarin of m/z 147.04 [M+H] identified in high intensity and the cinnamaldehyde of m/z 133.06 [M+H], identified in low intensity [31]. The antioxidant compounds belonging to phenolic acids class (m/z 353.27) were detected in high concentration in the samples. Furthermore, it is possible to observe differences in ion intensity between samples 7 and 15 analyzed at the same concentration, which implies the variation of their metabolic content and antioxidant potential.
Figure 3.
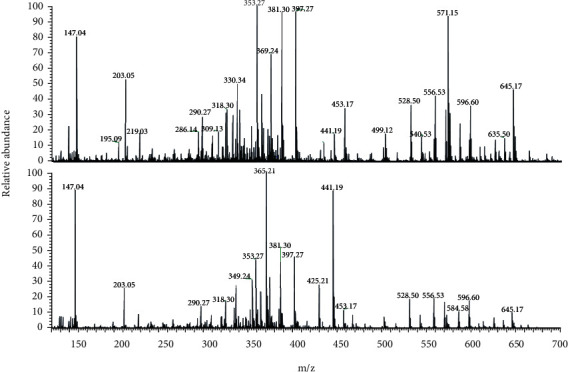
Mass spectrum (ESI(+)-MS)from cinnamon samples 15 (a) and 7 (b).
3.5. Study of Vascular Reactivity
Many studies indicate that antioxidant-rich food intake (mainly red wines, teas, seasoning, fruits, and vegetables) is linked with a protective action on the cardiovascular system in humans and animals [61, 62]. They produce, among several effects, vascular dilation in animals or patients, which could help control blood pressure levels [63, 64]. The present data showed that the both cinnamon samples tested induce a significant vasodilatory effect on isolated arteries at a very low concentration.
As shown in Figure 4, the cinnamon samples 7 and 15 added cumulatively (0–380 μg/mL) to the bath solution on the endothelium-intact arteries precontracted with phenylephrine-induced concentration-dependent vasodilation. The maximum effect for sample 7 (cin7) and sample 15 (cin15) was 95.8 ± 7.1% (n = 6) and 92.1 ± 6.4% (n = 6), respectively. This finding shows that endothelial nitric oxide production is the most important mediator to induce vascular dilation, since L-NAME (nitric oxide synthase inhibitor) almost abolished the vasorelaxant effect of both samples (8.2 ± 4.6%; n = 5 and 5.6 ± 3.8%; n = 5, respectively).
Figure 4.
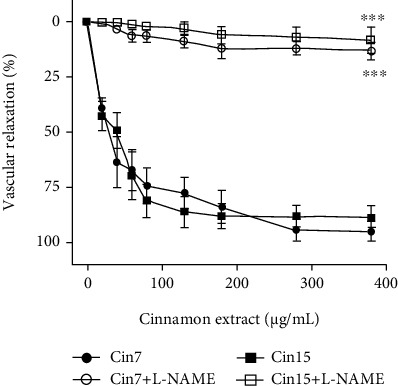
Vasodilatory effects of cinnamon samples 7 and 15 (cin7 and cin15) in endothelium-intact rat aortas precontracted with phenylephrine (0.1 μM) in the absence or presence (30 min) of the nitric oxide synthase inhibitor L-NAME (100 μM). The data points represent the mean ± SEM (n = 5 − 6) of the relaxing effect expressed as a percentage. Significant difference ∗∗∗p < 0.001.
The reactive chlorine species are well known by their high injuriousness in the cardiovascular system, leading to endothelial cell dysfunction, chronic and local inflammation, and impairment of endothelium-dependent vasorelaxation [6, 65]. In various pathological disorders of the cardiovascular system that generate an active inflammation (e.g., diabetes, hypertension, infarction, and atherosclerosis), the reactive chlorine species (OCl−) can range high concentrations, reaching micromolar levels in the tissues affected and local circulation [30].
In terms of vascular contraction, the treatment with OCl− increased the contractile effect induced by adrenergic stimulation from 1.13 ± 0.12 g (n = 7) to 2.07 ± 0.13 g (n = 5). The concomitant treatment with cinnamon samples 7 and 15 at low concentration (100 μg/mL) reduced the vascular contraction induced by phenylephrine to 0.90 ± 0.12 g (n = 6) and 1.51 ± 0.13 g (n = 6), respectively. However, the effect of sample 7 was more significant than sample 15, and it presented the level of contraction significantly smaller as compared to sample 15 (Figure 5(a)). At the highest concentration (500 μg/mL) the two cinnamon samples inhibited the action of OCl− with similar efficacy (Figure 5(b)).
Figure 5.
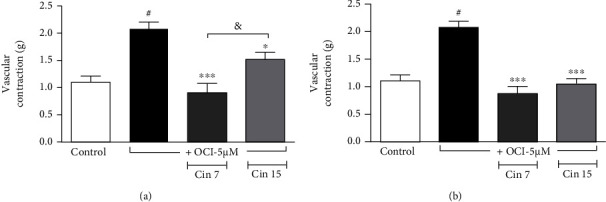
Vascular contraction induced by phenylephrine (0.1 μM) in endothelium-intact rat aortas exposed or not to hypochlorite (5 μM OCl−, 60 min). Some arteries were treated with cinnamon samples (cin7 and cin15) concomitantly to oxidative stimulus with OCl− at different concentrations (a) 100 μg/mL and (b) 500 μg/mL. Vertical bars represent the mean ± SEM values of the maximum contractile effect (n = 5 − 7 for all protocols). Significant difference #p < 0.001 compared to control. ∗∗∗p < 0.001 and ∗p < 0.05 compared to OCl− treatment. &p < 0.05 between groups cin7 and cin15.
4. Conclusions
This article evaluates the antioxidant capacity and activity of cinnamon, an important product worldwide consumed. This topic is very relevant, since the damage caused by free radicals is increasingly present in our population and can be reduced in our body by the ingestion of natural products rich in antioxidant compounds.
Cinnamon, although much studied for its antimicrobial property, is still little studied as a vasorelaxant. In addition, the electrochemical assays that generate the electrochemical index, as well as the use of a laccase-based biosensor from the fungus Marasmiellus colocasiae are unprecedented and therefore represent the innovation of the present work.
The antioxidant capacity of cinnamon samples was investigated through spectrophotometric and voltammetric methodologies. A high correlation coefficient of approximately 0.7 was found between EI and DPPH, ABTS, and Folin-Ciocalteu, which demonstrates a close relationship of the redox process of the antioxidant capacity in all methodologies. Electrochemical experiments evidenced high antioxidant quality of cinnamon due to the low oxidative potentials. Moreover, these results were significantly improved in a biosensor with the carbon paste-modified electrode using the laccase enzyme. Thus, these methodologies are efficient to study antioxidant capacity of natural products and emphasized the importance of cinnamon in a diet. The sample with the most potent antioxidant activity (7) and the least potent one (15) had similar vasodilatory activities, and both induce the nitric oxide production by endothelial cells. Furthermore, both samples tested reduced the oxidative injury evoked by OCl-, but sample 7 seems to be more efficient at low concentration.
Acknowledgments
The authors wish to thank the Conselho Nacional de Desenvolvimento Científico e Tecnológico (CNPq) and Coordenadoria de Aperfeiçoamento de Pessoal (CAPES) for their financial support and scholarships.
Data Availability
The authors confirm that the data supporting the findings of this study are available within the article, whereas, any doubt can be requested from the corresponding author.
Disclosure
Emily K. G. Moreno is the co-first author.
Conflicts of Interest
The authors declare that there is no conflict of interest regarding the publication of this paper.
Authors' Contributions
Emily K. G. Moreno conceptualized and supervised the study, carried out the methodology, was responsible for the software, validation, design, and formal analysis, wrote the original draft, and wrote, reviewed, and edited the manuscript. Isaac Y. L de Macêdo carried out the methodology, was responsible for the software, validation, and design, and wrote, reviewed, and edited the manuscript. Erica A. Batista carried out the methodology and wrote, reviewed, and edited the manuscript. Fabio B. Machado carried out the methodology and wrote, reviewed, and edited the manuscript. Gabrielle R. Santos carried out the methodology. Daniela M. L. Andrade carried out the methodology and wrote, reviewed, and edited the manuscript. Matheus L. Rocha conceptualized the study and wrote, reviewed, and edited the manuscript. Nerilson M. Lima carried out the methodology and wrote, reviewed, and edited the manuscript. Boniek G. Vaz carried out the methodology and wrote, reviewed, and edited the manuscript. Eric S. Gil was responsible for the funding and project administration, conceptualized and supervised the study, and wrote, reviewed, and edited the manuscript.
References
- 1.Pauletti A., Terrone G., Shekh-Ahmad T., et al. Targeting oxidative stress improves disease outcomes in a rat model of acquired epilepsy. Brain . 2019;142(7, article e39) doi: 10.1093/brain/awz130. [DOI] [PMC free article] [PubMed] [Google Scholar]
- 2.Kim G. H., Kim J. E., Rhie S. J., Yoon S. The role of oxidative stress in neurodegenerative diseases. Experimental Neurobiology . 2015;24(4):325–340. doi: 10.5607/en.2015.24.4.325. [DOI] [PMC free article] [PubMed] [Google Scholar]
- 3.Münzel T., Camici G. G., Maack C., Bonetti N. R., Fuster V., Kovacic J. C. Impact of oxidative stress on the heart and vasculature: part 2 of a 3-part series. Journal of the American College of Cardiology . 2017;70(2):212–229. doi: 10.1016/j.jacc.2017.05.035. [DOI] [PMC free article] [PubMed] [Google Scholar]
- 4.Tejero J., Shiva S., Gladwin M. T. Sources of vascular nitric oxide and reactive oxygen species and their regulation. Physiological Reviews . 2019;99(1):311–379. doi: 10.1152/physrev.00036.2017. [DOI] [PMC free article] [PubMed] [Google Scholar]
- 5.Li H., Cao Z., Zhang G., Thannickal V. J., Cheng G. Vascular peroxidase 1 catalyzes the formation of hypohalous acids: characterization of its substrate specificity and enzymatic properties. Free Radical Biology and Medicine . 2012;53(10):1954–1959. doi: 10.1016/j.freeradbiomed.2012.08.597. [DOI] [PMC free article] [PubMed] [Google Scholar]
- 6.Radovits T., Arif R., Bömicke T., et al. Vascular dysfunction induced by hypochlorite is improved by the selective phosphodiesterase-5-inhibitor vardenafil. European Journal of Pharmacology . 2013;710(1-3):110–119. doi: 10.1016/j.ejphar.2013.04.012. [DOI] [PubMed] [Google Scholar]
- 7.Bacchetti T., Turco I., Urbano A., Morresi C., Ferretti G. Fruit and vegetable intake and its relationhip to dietary antioxidant capacity and markers of oxidative stress. A gender-related study. Nutrition . 2018;61:164–172. doi: 10.1016/j.nut.2018.10.034. [DOI] [PubMed] [Google Scholar]
- 8.Kolarzyk E., Pietrzycka A., Zając J., Morawiecka-Baranek J. Relationship between dietary antioxidant index (DAI) and antioxidants level in plasma of Kraków inhabitants. Advances in Clinical and Experimental Medicine . 2017;26(3):393–399. doi: 10.17219/acem/61834. [DOI] [PubMed] [Google Scholar]
- 9.Varì R., Scazzocchio B., Del Papa S. Dietary habits and gender differences. Italian Journal of Gender-Specific Medicine . 2017;3(2):55–58. doi: 10.1723/2836.28632. [DOI] [Google Scholar]
- 10.Wang Y. H., Avula B., Nanayakkara N. P. D., Zhao J., Khan I. A. Cassia cinnamon as a source of coumarin in cinnamon-flavored food and food supplements in the United States. Journal of Agricutural and Food Chemistry . 2013;61(18):4470–4476. doi: 10.1021/jf4005862. [DOI] [PubMed] [Google Scholar]
- 11.Zaidi S. F., Aziz M., Muhammad J. S., Kadowaki M. Review: Diverse pharmacological properties of Cinnamomum cassia: a review. Pakistan Journal of Pharmaceutical Sciences . 2015;28(4):1433–1438. [PubMed] [Google Scholar]
- 12.Vasconcelos N. G., Croda J., Simionatto S. Antibacterial mechanisms of cinnamon and its constituents: a review. Microbial Pathogenesis . 2018;120:198–203. doi: 10.1016/j.micpath.2018.04.036. [DOI] [PubMed] [Google Scholar]
- 13.Hadi A., Campbell M. S., Hassani B., Pourmasoumi M., Salehi-sahlabadi A., Hosseini S. A. The effect of cinnamon supplementation on blood pressure in adults: a systematic review and meta-analysis of randomized controlled trials. Clinical Nutrition ESPEN . 2020;36:10–16. doi: 10.1016/j.clnesp.2020.01.002. [DOI] [PubMed] [Google Scholar]
- 14.Dravie E. E., Kortei N. K., Essuman E. K., Tettey C. O., Boakye A. A., Hunkpe G. Antioxidant, phytochemical and physicochemical properties of sesame seed (Sesamum indicum L) Scientific African . 2020;8, article e00349 doi: 10.1016/j.sciaf.2020.e00349. [DOI] [Google Scholar]
- 15.Ghoora M. D., Haldipur A. C., Srividya N. Comparative evaluation of phytochemical content, antioxidant capacities and overall antioxidant potential of select culinary microgreens. Journal of Agriculture and Food Research . 2020;2, article 100046 doi: 10.1016/j.jafr.2020.100046. [DOI] [Google Scholar]
- 16.Marsoul A., Ijjaali M., Oumous I., Bennani B., Boukir A. Determination of polyphenol contents in Papaver rhoeas L. flowers extracts (soxhlet, maceration), antioxidant and antibacterial evaluation. Materials Today: Proceedings . 2020;31(supplement 1):S183–S189. doi: 10.1016/j.matpr.2020.08.082. [DOI] [Google Scholar]
- 17.Abdel Azeem S. M., Al Mohesen I. A., Ibrahim I. A. M. H. Analysis of total phenolic compounds in tea and fruits using diazotized aminobenzenes colorimetric spots. Food Chemistry FOCH . 2020;332, article 127392 doi: 10.1016/j.foodchem.2020.127392. [DOI] [PubMed] [Google Scholar]
- 18.Xie J., Schaich K. M. Re-evaluation of the 2,2-diphenyl1-picrylhydrazyl free radical (DPPH) assay for antioxidant activity. Journal of Agricultural and Food Chemistry . 2014;62(19):4251–4260. doi: 10.1021/jf500180u. [DOI] [PubMed] [Google Scholar]
- 19.Schaich K. M., Tian X., Xie J. Hurdles and pitfalls in measuring antioxidant efficacy: a critical evaluation of ABTS, DPPH, and ORAC assays. Journal of Functional Foods . 2015;14:111–125. doi: 10.1016/j.jff.2015.01.043. [DOI] [Google Scholar]
- 20.Leite K. C. D. S., Garcia L. F., Lobón G. S., et al. Antioxidant activity evaluation of dried herbal extracts: an electroanalytical approach. Revista Brasileira de Farmaco . 2018;28(3):325–332. doi: 10.1016/j.bjp.2018.04.004. [DOI] [Google Scholar]
- 21.David M., Serban A., Radulescu C., Danet A. F., Florescu M. Bioelectrochemical evaluation of plant extracts and gold nanozyme-based sensors for total antioxidant capacity determination. Bioelectrochemistry . 2019;129:124–134. doi: 10.1016/j.bioelechem.2019.05.011. [DOI] [PubMed] [Google Scholar]
- 22.Tomac I., Šeruga M., Labuda J. Evaluation of antioxidant activity of chlorogenic acids and coffee extracts by an electrochemical DNA-based biosensor. Food Chemistry . 2020;325, article 126787 doi: 10.1016/j.foodchem.2020.126787. [DOI] [PubMed] [Google Scholar]
- 23.Čižmek L., Komorsky-Lovrić S. Electrochemistry as a screening method in determination of carotenoids in crustacean samples used in everyday diet. Food Chemistry . 2020;309, article 125706 doi: 10.1016/j.foodchem.2019.125706. [DOI] [PubMed] [Google Scholar]
- 24.Macêdo I. Y. L., Garcia L. F., Oliveira Neto J. R., et al. Electroanalytical tools for antioxidant evaluation of red fruits dry extracts. Food Chemistry . 2017;217:326–331. doi: 10.1016/j.foodchem.2016.08.082. [DOI] [PubMed] [Google Scholar]
- 25.Liu L., Anwar S., Ding H., et al. Electrochemical sensor based on F,N-doped carbon dots decorated laccase for detection of catechol. Journal of Electroanalytical Chemistry . 2019;840:84–92. doi: 10.1016/j.jelechem.2019.03.071. [DOI] [Google Scholar]
- 26.Mohtara L. G., Arandab P., Messinab G. A., et al. Amperometric biosensor based on laccase immobilized onto a nanostructured screen-printed electrode for determination of polyphenols in propolis. Microchemical Journal . 2019;144:13–18. doi: 10.1016/j.microc.2018.08.038. [DOI] [Google Scholar]
- 27.Batista É. A., Silva G. N. M., Sgobbi L. F., et al. Enzymatic electroanalytical biosensor based on Maramiellus colocasiae fungus for detection of phytomarkers in infusions and green tea kombucha. Biosensors . 2021;11(3):p. 91. doi: 10.3390/bios11030091. [DOI] [PMC free article] [PubMed] [Google Scholar]
- 28.Oliveira-Neto J. R., Rezende S. G., Lobón G. S., et al. Electroanalysis and laccase-based biosensor on the determination of phenolic content and antioxidant power of honey samples. Food Chemistry . 2017;237:1118–1123. doi: 10.1016/j.foodchem.2017.06.010. [DOI] [PubMed] [Google Scholar]
- 29.Olgun A. O., Ozyurt D., Berker K. I., Demirata B., Apak R. Folin-Ciocalteu spectrophotometric assay of ascorbic acid in pharmaceutical tablets and orange juice with pH adjustment and pre-extraction of lanthanum(III)-flavonoid complexes. Journal of the Science of Food and Agriculture . 2014;94(12):2401–2408. doi: 10.1002/jsfa.6569. [DOI] [PubMed] [Google Scholar]
- 30.Zhang C., Patel R., Eiserich J. P., et al. Endothelial dysfunction is induced by proinflammatory oxidant hypochlorous acid. American Journal of Physiology-Heart and Circulatory Physiology . 2001;281(4):H1469–H1475. doi: 10.1152/ajpheart.2001.281.4.H1469. [DOI] [PubMed] [Google Scholar]
- 31.Liang Y., Li Y., Sun A., Liu X. Chemical compound identification and antibacterial activity evaluation of cinnamon extracts obtained by subcritical n-butane and ethanol extraction. Food Science & Nutrition . 2019;7(6):2186–2193. doi: 10.1002/fsn3.1065. [DOI] [PMC free article] [PubMed] [Google Scholar]
- 32.Martins C. R., Lopes W. A., de Andrade J. B. Solubilidade das substâncias orgânicas. Química Nova . 2013;36(8):1248–1255. doi: 10.1590/S0100-40422013000800026. [DOI] [Google Scholar]
- 33.Przygodzka M., Zielińska D., Ciesarová Z., Kukurová K., Zieliński H. Comparison of methods for evaluation of the antioxidant capacity and phenolic compounds in common spices. LWT - Food Science and Technology . 2014;58(2):321–326. doi: 10.1016/j.lwt.2013.09.019. [DOI] [Google Scholar]
- 34.Ahmadpour S., Tashkhourian J., Hemmateenejad B. A chemometric investigation on the influence of the nature and concentration of supporting electrolyte on charging currents in electrochemistry. Journal of Electroanalytical Chemistry . 2020;871, article 114296 doi: 10.1016/j.jelechem.2020.114296. [DOI] [Google Scholar]
- 35.de Souza-Sartori J. A., Scalise C., Baptista A. S., Lima R. B., de Aguiar C. L. Parameters of influence on extraction of phenolic compounds from sugarcane tops with total antioxidant activity. Bioscience Journal . 2013;29(2):297–307. [Google Scholar]
- 36.Yang J., Lin Q., Ng T. B., Ye X., Lin J. Purification and characterization of a novel laccase from Cerrena sp. HYB07 with dye decolorizing ability. PLoS One . 2014;9(10):1–13. doi: 10.1371/journal.pone.0110834. [DOI] [PMC free article] [PubMed] [Google Scholar]
- 37.Zheng F., An Q., Meng G., et al. A novel laccase from white rot fungus Trametes orientalis: purification, characterization, and application. International Journal of Biological Macromolecules . 2017;102:758–770. doi: 10.1016/j.ijbiomac.2017.04.089. [DOI] [PubMed] [Google Scholar]
- 38.Rebelo M. J., Rego R., Ferreira M., Oliveira M. C. Comparative study of the antioxidant capacity and polyphenol content of Douro wines by chemical and electrochemical methods. Food Chemistry . 2013;141(1):566–573. doi: 10.1016/j.foodchem.2013.02.120. [DOI] [PubMed] [Google Scholar]
- 39.Myland J. C., Oldham K. B. Cottrell’s equation revisited: an intuitive, but unreliable, novel approach to the tracking of electrochemical diffusion. Electrochemistry Communications . 2004;6(4):344–350. doi: 10.1016/j.elecom.2004.01.013. [DOI] [Google Scholar]
- 40.Robledo S. N., Pierini G. D., Nieto C. H. D., Fernández H., Zon M. A. Development of an electrochemical method to determine phenolic monoterpenes in essential oils. Talanta . 2019;196:362–369. doi: 10.1016/j.talanta.2018.12.069. [DOI] [PubMed] [Google Scholar]
- 41.Rodríguez-Delgado M. M., Alemán-Nava G. S., Rodríguez-Delgado J. M., et al. Laccase-based biosensors for detection of phenolic compounds. TrAC Trends in Analytical Chemistry . 2015;74:21–45. doi: 10.1016/j.trac.2015.05.008. [DOI] [Google Scholar]
- 42.Othman A. M., Wollenberger U. Amperometric biosensor based on coupling aminated laccase to functionalized carbon nanotubes for phenolics detection. International Journal of Biological Macromolecules . 2020;153:855–864. doi: 10.1016/j.ijbiomac.2020.03.049. [DOI] [PubMed] [Google Scholar]
- 43.Shahid M. Z., Saima H., Yasmin A., Nadeem M. T., Imran M., Afzaal M. Antioxidant capacity of cinnamon extract for palm oil stability. Lipids in Health and Disease . 2018;17(1):1–8. doi: 10.1186/s12944-018-0756-y. [DOI] [PMC free article] [PubMed] [Google Scholar]
- 44.Azimi P., Ghiasvand R., Feizi A., Hariri M., Abbasi B. Effects of cinnamon, cardamom, saffron, and ginger consumption on markers of glycemic control, lipid profile, oxidative stress, and inflammation in type 2 diabetes patients. The Review of Diabetic Studies: RDS . 2014;11(3-4):258–266. doi: 10.1900/RDS.2014.11.258. [DOI] [PMC free article] [PubMed] [Google Scholar]
- 45.Goyal M., Kaur H., Bhandari M., Rizvanov A. A., Khaiboullina S. F., Baranwal M. Antioxidant and immune effects of water soluble polysaccharides isolated from Cinnamomum verum bark. BioNano Science . 2018;8(3):935–940. doi: 10.1007/s12668-018-0542-3. [DOI] [Google Scholar]
- 46.Malsawmtluangi L., Nautiyal B. P., Hazarika T., Chauhan R. S., Tava A. Essential oil composition of bark and leaves of Cinammoum verum Bertch. & Presl from Mizoram, North East India. Journal of Essential Oil Research . 2016;28(6):551–556. doi: 10.1080/10412905.2016.1167131. [DOI] [Google Scholar]
- 47.Li Y. Q., Kong D. X., Wu H. Analysis and evaluation of essential oil components of cinnamon barks using GC–MS and FTIR spectroscopy. Industrial Crops and Products . 2013;41:269–278. doi: 10.1016/j.indcrop.2012.04.056. [DOI] [Google Scholar]
- 48.Dvorackova E., Snoblova M., Chromcova L., Hrdlicka P. Effects of extraction methods on the phenolic compounds contents and antioxidant capacities of cinnamon extracts. Food Science and Biotechnology . 2015;24(4):1201–1207. doi: 10.1007/s10068-015-0154-4. [DOI] [Google Scholar]
- 49.Klejdus B., Kováčik J. Quantification of phenols in cinnamon: a special focus on “total phenols” and phenolic acids including DESI-Orbitrap MS detection. Industrial Crops and Products . 2016;83:774–780. doi: 10.1016/j.indcrop.2015.11.060. [DOI] [Google Scholar]
- 50.Yang C. H., Li R. X., Chuang L. Y. Antioxidant activity of various parts of Cinnamomum cassia extracted with different extraction methods. Molecules . 2012;17(6):7294–7304. doi: 10.3390/molecules17067294. [DOI] [PMC free article] [PubMed] [Google Scholar]
- 51.Sharma V., Rao L. J. M. An overview on chemical composition, bioactivity and processing of leaves of Cinnamomum tamala. Critical Reviews in Food Science and Nutrition . 2014;54(4):433–448. doi: 10.1080/10408398.2011.587615. [DOI] [PubMed] [Google Scholar]
- 52.Li H. B., Wong C. C., Cheng K. W., Chen F. Antioxidant properties in vitro and total phenolic contents in methanol extracts from medicinal plants. LWT-Food Science and Technology . 2008;41(3):385–390. doi: 10.1016/j.lwt.2007.03.011. [DOI] [Google Scholar]
- 53.El-Baroty G. S., Abd El-Baky H. H., Farag R. S., Saleh M. A. Characterization of antioxidant and antimicrobial compounds of cinnamon and ginger essential oils. African Journal of Biochemistry Research . 2010;4(6):167–174. [Google Scholar]
- 54.Chakraborty A., Sankaran V., Ramar M., Chellappan D. R. Chemical analysis of leaf essential oil of Cinnamomum verum from Palni hills, Tamil Nadu. Journal of Chemical and Pharmaceutical Science . 2015;8(3):476–479. [Google Scholar]
- 55.Sharma U. K., Sharma A. K., Pandey A. K. Medicinal attributes of major phenylpropanoids present in cinnamon. BMC Complementary and Alternative Medicine . 2016;16(1):1–11. doi: 10.1186/s12906-016-1147-4. [DOI] [PMC free article] [PubMed] [Google Scholar]
- 56.Nabavi S. F., Di Lorenzo A., Izadi M., Sobarzo-Sánchez E., Daglia M., Nabavi S. M. Antibacterial effects of cinnamon: from farm to food, cosmetic and pharmaceutical industries. Nutrients . 2015;7(9):7729–7748. doi: 10.3390/nu7095359. [DOI] [PMC free article] [PubMed] [Google Scholar]
- 57.Gulcin I., Kaya R., Goren A. C., et al. Anticholinergic, antidiabetic and antioxidant activities of cinnamon (Cinnamomum verum) bark extracts: polyphenol contents analysis by LC-MS/MS. International Journal of Food Properties . 2019;22(1):1511–1526. doi: 10.1080/10942912.2019.1656232. [DOI] [Google Scholar]
- 58.Lin C. Y., Yeh T. F., Cheng S. S., Chang S. T. Complementary relationship between trans-cinnamaldehyde and trans-cinnamyl acetate and their seasonal variations in Cinnamomum osmophloeum ct. cinnamaldehyde. Industrial Crops and Products . 2019;127:172–178. doi: 10.1016/j.indcrop.2018.10.074. [DOI] [Google Scholar]
- 59.Song F., Li H., Sun J., Wang S. Protective effects of cinnamic acid and cinnamic aldehyde on isoproterenol-induced acute myocardial ischemia in rats. Journal of Ethnopharmacology . 2013;150(1):125–130. doi: 10.1016/j.jep.2013.08.019. [DOI] [PubMed] [Google Scholar]
- 60.Muhammad D. R. A., Dewettinck K. Cinnamon and its derivatives as potential ingredient in functional food—a review. International Journal of Food Properties . 2017;20(2):2237–2263. doi: 10.1080/10942912.2017.1369102. [DOI] [Google Scholar]
- 61.Li H., Förstermann U. Red wine and cardiovascular health. Circulation Research . 2012;111(8):959–961. doi: 10.1161/CIRCRESAHA.112.278705. [DOI] [PubMed] [Google Scholar]
- 62.Souza C. G., Andrade D. M. L., Jordão J. B. R., et al. Radical scavenger capacity of jabuticaba fruit (Myrciaria cauliflora) and its biological effects in hypertensive rats. Oxidative Medicine and Cellular Longevity . 2017;2017:10. doi: 10.1155/2017/2383157.2383157 [DOI] [PMC free article] [PubMed] [Google Scholar]
- 63.Porteri E., Rizzoni D., De Ciuceis C., et al. Vasodilator effects of red wines in subcutaneous small resistance artery of patients with essential hypertension. American Journal of Hypertension . 2010;23(4):373–378. doi: 10.1038/ajh.2009.280. [DOI] [PubMed] [Google Scholar]
- 64.Andrade D. L. M., Reis C. F., Castro P. F. S., et al. Vasorelaxant and hypotensive effects of jaboticaba fruit (Myrciaria cauliflora) extract in rats. Evidence-Based Complementary and Alternative Medicine . 2015;2015:8. doi: 10.1155/2015/696135.696135 [DOI] [PMC free article] [PubMed] [Google Scholar]
- 65.Davies M. J., Hawkins C. L. The role of myeloperoxidase in biomolecule modification, chronic inflammation, and disease. Antioxidants & Redox Signaling . 2020;32(13):957–981. doi: 10.1089/ars.2020.8030. [DOI] [PubMed] [Google Scholar]
Associated Data
This section collects any data citations, data availability statements, or supplementary materials included in this article.
Data Availability Statement
The authors confirm that the data supporting the findings of this study are available within the article, whereas, any doubt can be requested from the corresponding author.


