Figure 3.
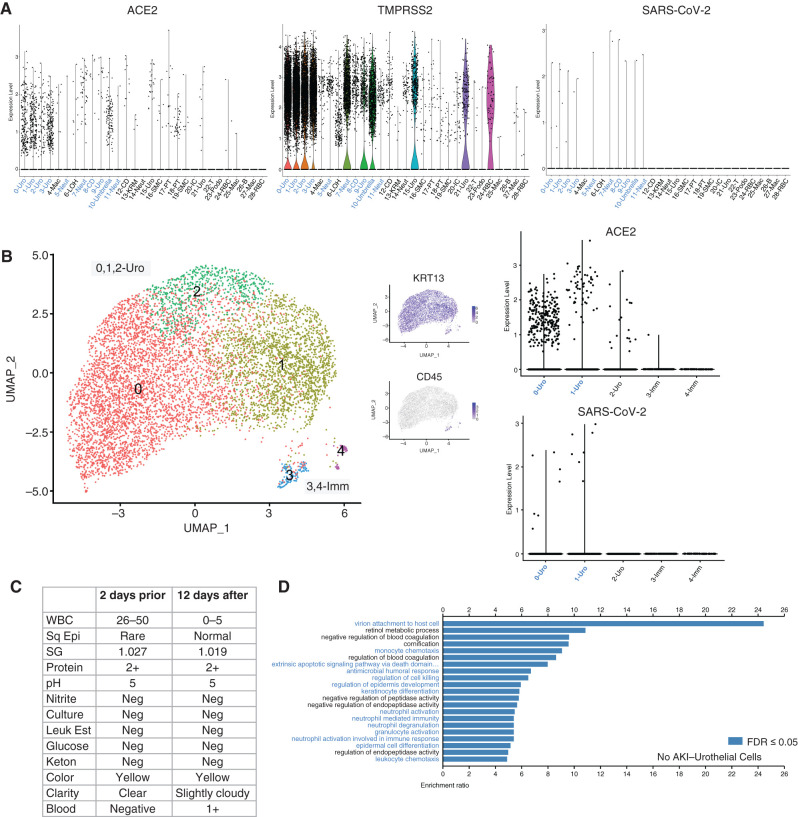
Detection of direct infection of urothelial cells by severe acute respiratory syndrome coronavirus 2 (SARS-CoV-2). (A) Violin plots of ACE2, TMPRSS2, and SARS-CoV-2 gene expression among sequenced cell types. Cell types with identified SARS-CoV-2 gene expression are identified in blue to identify overlap between SARS-CoV-2 receptor and gene expression. (B) Individual analysis of patient 7: UMAP plots and ACE2 and SARS-CoV-2 expression identifying the presence of SARS-CoV-2 gene expression within urothelial cells. (C) Urinalysis laboratory values from urine samples taken from patient 7 2 days prior and 12 days after urine collection for single-cell RNA sequencing. (D) Gene enrichment analysis using the WebGestaltR Biologic Process to identify upregulated pathways in the urothelial cells of patient 7. Pathways involved in viral infection and immune response are shown in blue with a false discovery rate (FDR) of ≤0.05. Sq Epi, squamous epithelial cells; Leuk Est, leukocyte esterase; lmm, immune cells; Neg, negative; SG, specific gravity; WBC, white blood cell.

