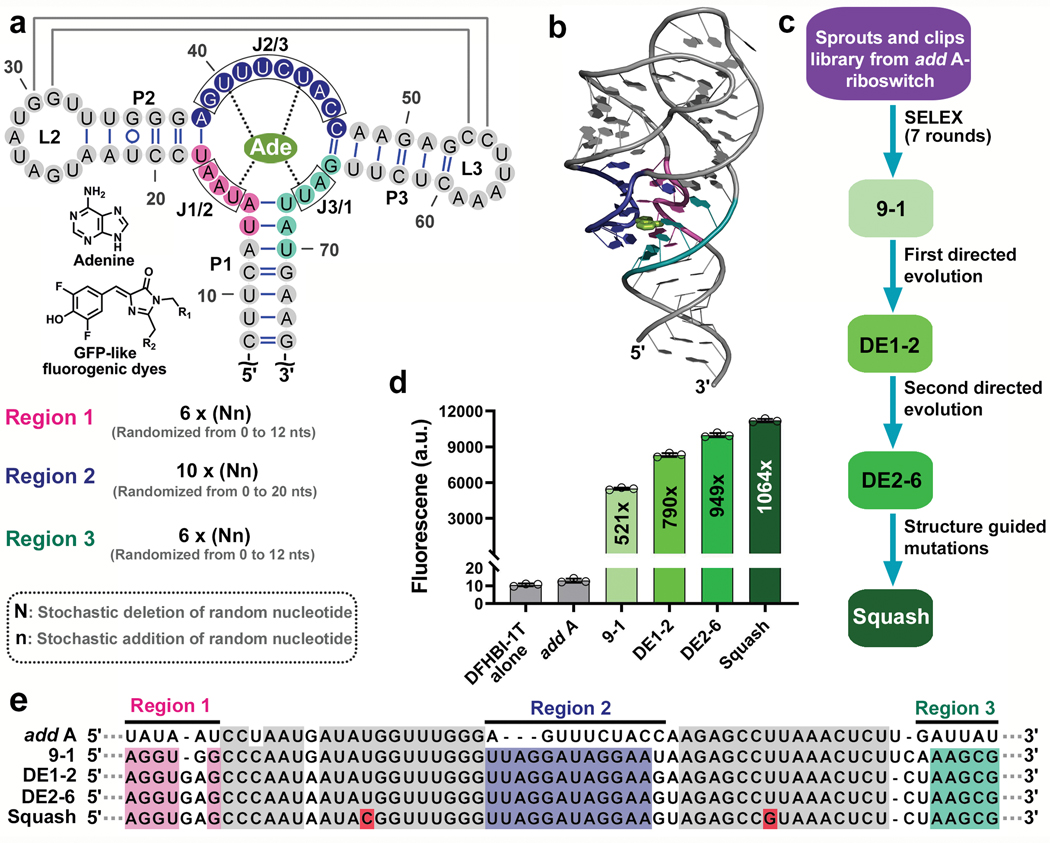
Fig. 1 |. Evolution of the add A-riboswitch aptamer into fluorogenic aptamer Squash.
a, Strategy for evolution of the add A-riboswitch aptamer. Indicated are helices P1-P3, junctional strands (J1/2, J2/3, J3/1), kissing loop (gray lines), and adenine interactions with the aptamer (dotted line). The chemical structure of adenine and fluorophores are shown. Three regions (pink, blue and teal), which include J1/2, J2/3, and J3/1 were randomized in both size and sequence resulting in a sprouts/clips library for SELEX. Each nucleotide in the colored regions was replaced using a combination of random stochastic deletion (designated “N”) and random stochastic insertion (designated “n”). b, Three dimensional structure of the add A-riboswitch aptamer highlighting the adenine-binding pocket (PDB 1Y26). The mutagenized regions are shown in the same color as Fig. 1a. Adenine is shown in light green. c, Evolution of the add A-riboswitch aptamer into Squash, a DFHBI-1T-binding aptamer. The sprouts/clips library was selected for binding to DFHBI-conjugated agarose resulting in aptamer 9–1. Aptamer 9–1 was subjected to two consecutive rounds of directed evolution generating DE2–6. A pair of mutations was introduced in DE2–6 to strengthen the kissing loop interaction resulting in Squash. d, Fluorescence activation of DFHBI-1T by different aptamer intermediates that led to Squash. The values inside the bars indicate fold-activation of DFHBI-1T fluorescence by the corresponding aptamer. Data represent mean values ± s.d. for n=3 independent experiments. e, The Squash aptamer shows ligand-binding pocket expansion compared to the parental add A-riboswitch aptamer. Aptamers at different stages of Squash evolution are aligned. Constant sequences are indicated with gray dots. The sequences outside the randomized regions are shown in gray. Shown in red are U→C and U→G mutations that were introduced to enhance the kissing loop interaction.

