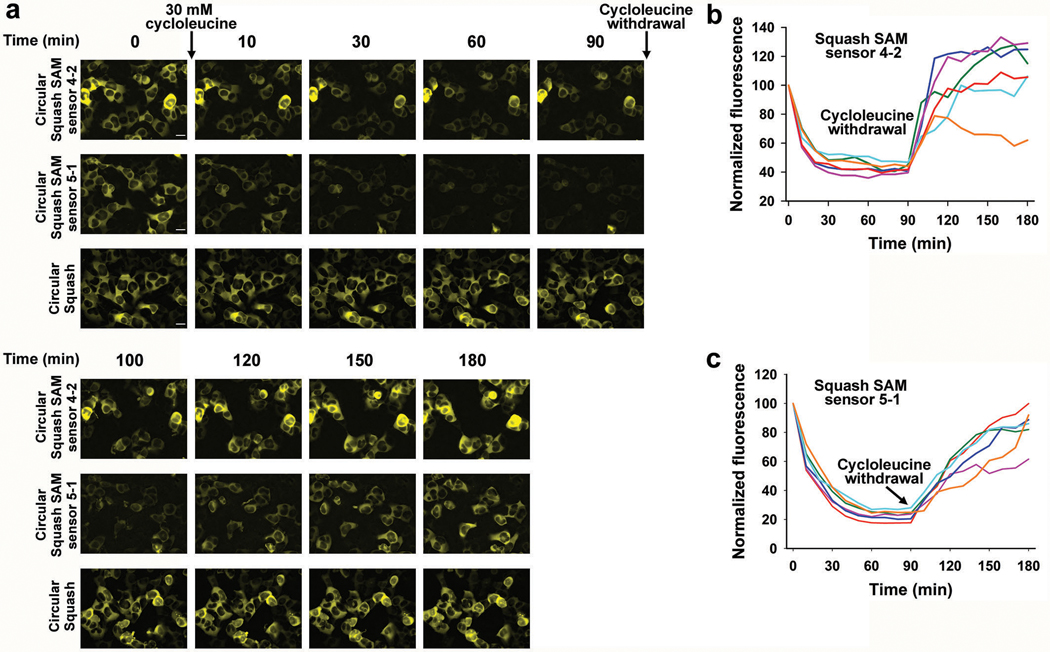
Extended Data Fig. 6. Detection of intracellular SAM levels using Squash-based SAM sensors.
a, Detection of intracellular SAM levels using the Squash-SAM sensor 4–2 and 5–1. HEK293T cells were transfected with the Tornado plasmids expressing the sensors or the constitutively fluorescent Squash aptamer (no SAM dependent fluorescence enhancement) as circular RNAs. Cells expressing the circular SAM biosensors or circular Squash were incubated with 10 μM DFHO and imaged every 10 min after treatment with 30 mM cycloleucine (an inhibitor of the major SAM biosynthesis enzyme, MAT2A) for 90 min total. Following this, cycloleucine was removed by replacing the imaging media with cycloleucine-free media. Images were taken again at 10 min intervals for 90 min. Images are shown at specific intervals along with results for representative cells. Cells expressing the circular sensors showed drop in the cellular fluorescence during cycloleucine treatment and increase in cellular fluorescence during cycloleucine withdrawal. However, cell expressing circular Squash did not show any change in cellular fluorescence during this treatment. Scale bar, 20 μm
b, c, Quantification of live-cell SAM levels based on Squash-SAM sensors 4–2 (b) and 5–1 (c) respectively. Cellular mean fluorescence intensity was calculated for each sensor and normalized to maximum intensity at time point 0. The normalized values of mean cellular fluorescence intensity were plotted against time at 10 min intervals for six different cells. Each cell is represented using a different color. For each sensor, SAM decay was observed following addition of cycloleucine and SAM recovery is seen after withdrawal of cycloleucine. Interestingly for both the sensors, the SAM decay profile for each individual cell is very similar while the SAM recovery profiles are distinctly different.

