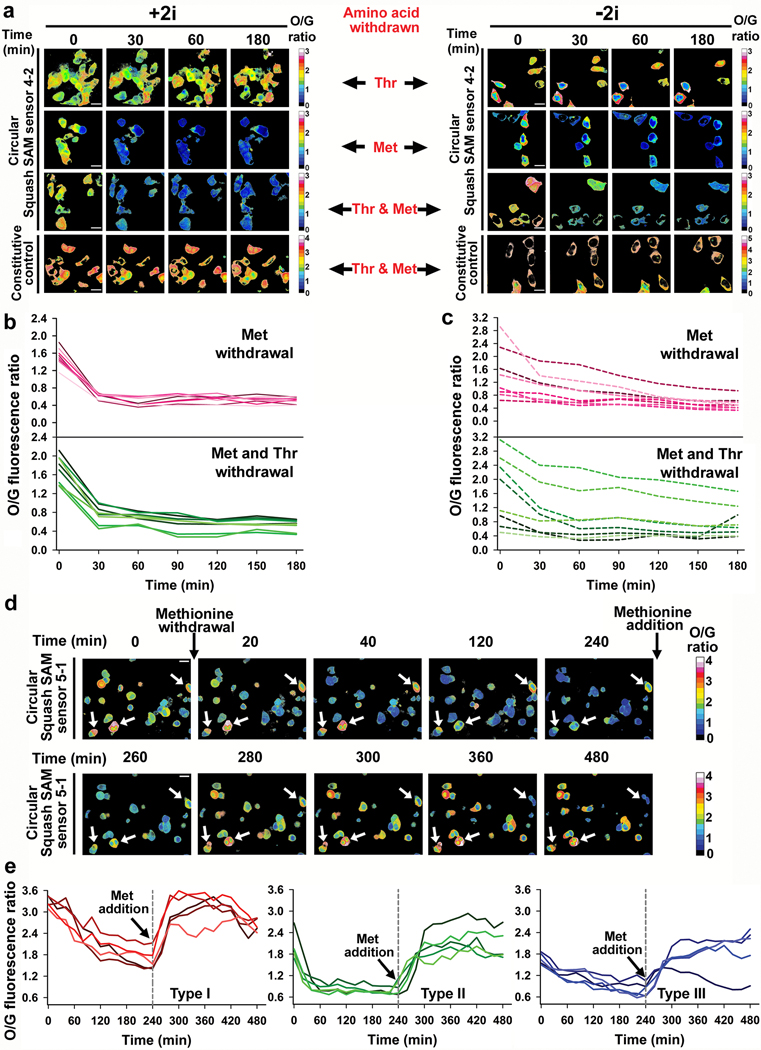
Fig. 5 |. Metabolic origin of SAM in different cell types measured by the ratiometric sensor.
a, SAM levels in individual mES cells were determined using the O/G fluorescence ratio at 30 min intervals after withdrawing threonine, methionine or both. Threonine depletion did not lead to a reduction in SAM levels. The control constitutively fluorescent Squash was not affected by withdrawal of threonine and methionine. Scale bar, 20 μm. b, SAM trajectory plots of O/G ratio in individual mES cells cultured in +2i upon withdrawal of methionine or both threonine and methionine. Overall, low cell-to-cell variation was seen (n = 8 cells from three separate experiments). c, SAM trajectory plots of O/G ratio in individual mES cells cultured in −2i upon withdrawal of methionine or both threonine and methionine shows high cell-to-cell variability. The rate of SAM drop was slower than the rate in cells cultured in +2i (n = 8 cells from three separate experiments). d, Effect of methionine withdrawal on SAM level in HCT116 cancer cells. SAM levels showed high cell-to-cell variability at baseline. SAM levels were measured at 20 min time intervals after methionine withdrawal and after methionine (100 μM) addition. Cells indicated with a white arrow start with a very high level of SAM and show a slow drop in SAM levels over time, indicating low SAM utilization. Scale bar, 20 μm. e, Methionine withdrawal shows distinct metabolic subtypes based on SAM loss. Type I cells show high basal levels of SAM and a slow drop in SAM levels upon methionine depletion. Type II cells show intermediate levels of SAM and a rapid drop in SAM levels upon methionine depletion. Type III cells show low basal levels of SAM and a slow drop in SAM levels after methionine depletion. n = 5 cells for each type, from three separate experiments.

