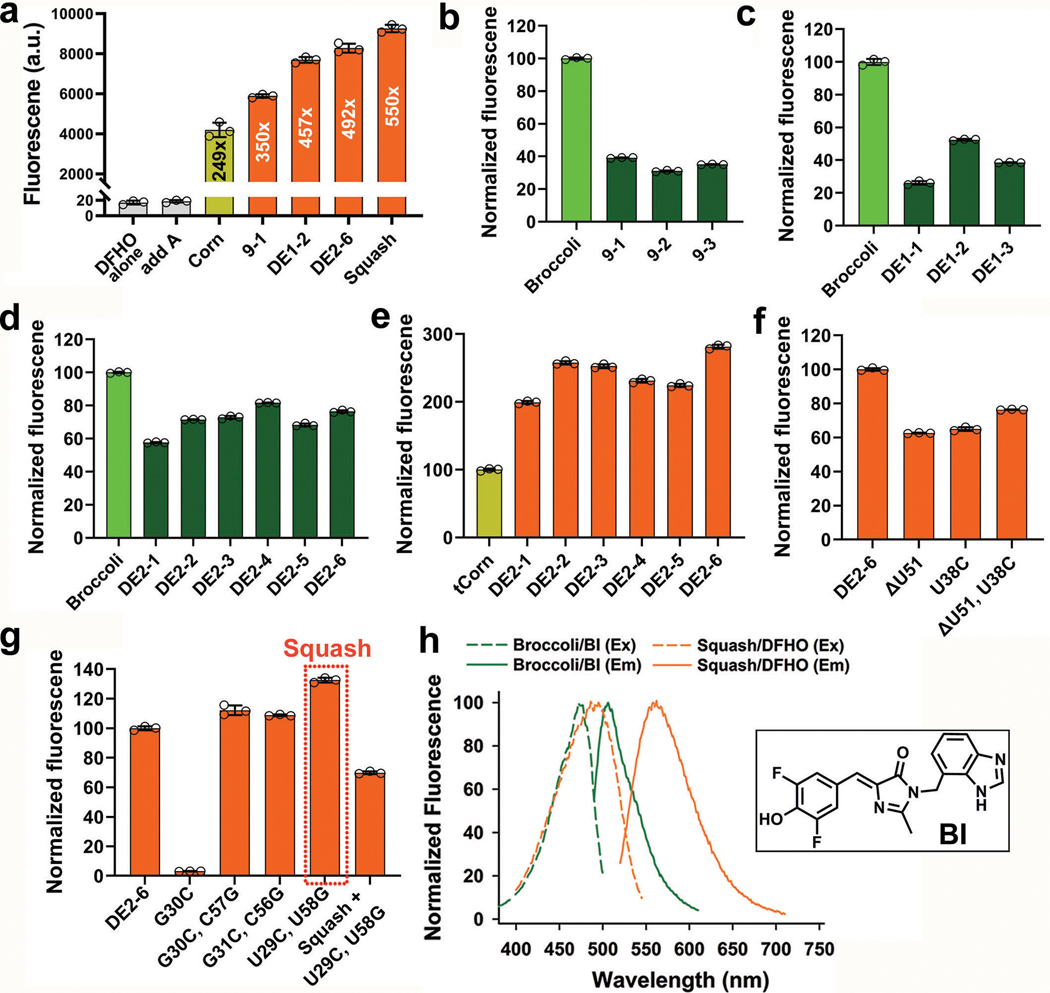
Extended Data Fig. 1. Characterization of the fluorescence properties of different intermediates during development of Squash.
a, Fluorescence activation of DFHO by Squash and its precursors. Fluorescence was measured with 200 nM dye and 10 μM RNA (ex: 495 nm, em: 562 nm, except for Corn; ex: 505 nm, em: 545 nm). Data represent mean values ± s.d. for n=3 independent experiments. Squash showed >2-fold activation of DFHO compared to Corn.
b, Fluorescence of initial hits after Round 7 of SELEX. In vitro transcribed RNAs from each hit (1 μM final) were mixed with DFHBI-1T (10 μM final) and the fluorescence was measured (ex: 452 nm, em: 503 nm, except for Broccoli; ex: 472 nm, em: 507 nm). Data represent mean values ± s.d. for n=3 independent experiments.
c,d, Fluorescence measurements of the hits with DFHBI-1T after first (c) and second (d) round of directed evolution, measured as in panel b. Data represent mean values ± s.d. for n=3 independent experiments.
e, Fluorescence measurements of hits using DFHO after the second round of directed evolution measured as in panel a. The fluorescence of the hits were normalized against Corn. Data represent mean values ± s.d. for n=3 independent experiments.
f, DE2–6 has one bulged nucleotide (U51) and one G•U pair based on mFold (Supplementary Figure 3d). Elimination of the bulge, the G•U pair, or both did not improve fluorescence of DE2–6. Fluorescence was measured as in a. Data represent mean values ± s.d. for n=3 independent experiments.
g, Mutation (G30C) of the kissing loop of DE2–6 resulted in loss of fluorescence which was recovered by a complementary mutation (C57G) in the opposite loop of the predicted kissing loop. Similar results were also observed for the other kissing loop basepair. Two mutations (U29C, U58G) created an extra G•C basepair in the kissing loop compared to add A-aptamer and resulted in ~20% increase in fluorescence of DE2–6. Further improvement of the kissing loop interaction cannot be achieved by further mutations (A28G + U59C in Squash). Data represent mean values ± s.d. for n=3 independent experiments.
h, Although Broccoli-BI and Squash-DFHO (20 μM RNA, 2 μM dye) excitation spectra overlap, their emission maxima show ~57 nm separation. Structure of BI is shown in the inset.

