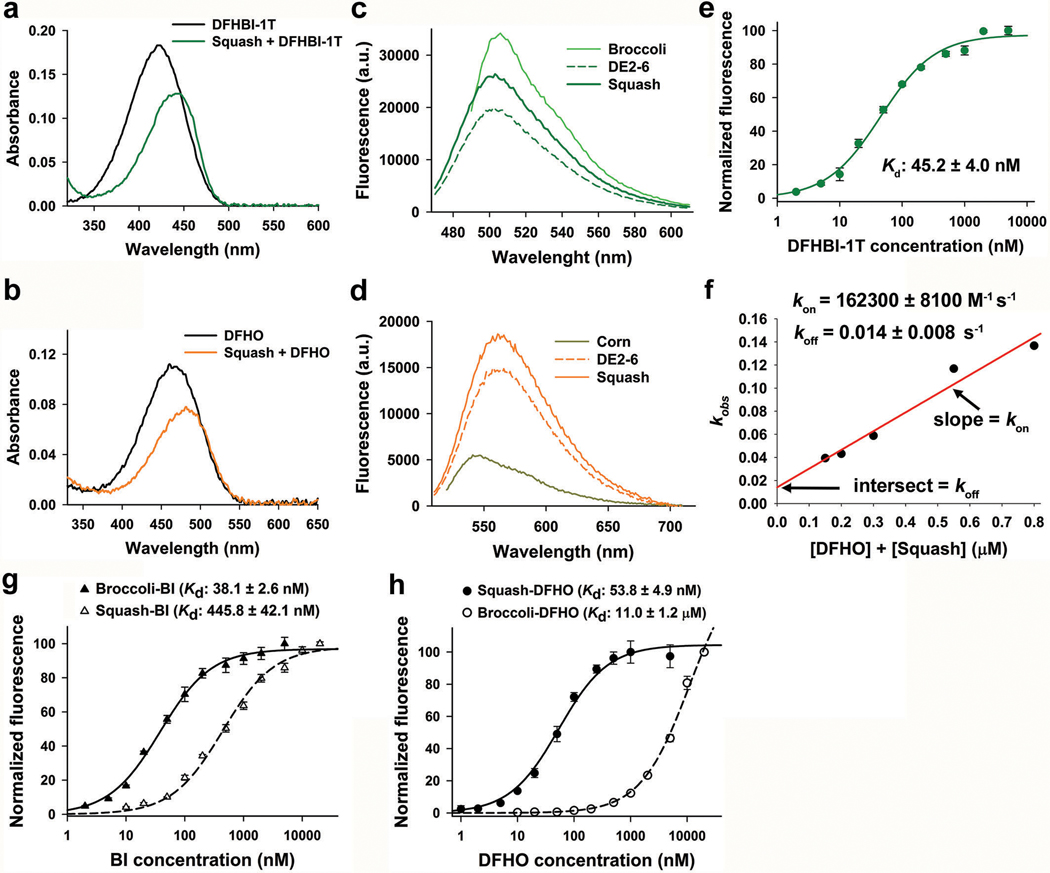
Extended Data Fig. 2. Photophysical and biophysical characterization of Squash.
a, Absorbance spectra (50 μM RNA, 5 μM DFHBI-1T) of DFHBI-1T alone and in complex with Squash demonstrates a smaller red shift (Abs max: 450 nm) compared to Spinach (Abs max: 470 nm)20 and Broccoli (Abs max: 469 nm)21. Excess RNA was used to ensure binding of nearly all fluorophore.
b, DFHO shows a red-shifted absorbance spectrum upon binding Squash (50 μM RNA, 5 μM DFHO).
c, Both Squash and Broccoli shows similar emission maxima. Squash also showed higher fluorescence (10 μM RNA, 1 μM DFHBI-1T, ex. 452 nm for Squash and 472 nm for Broccoli) intensity with DFHBI-1T compared to DE2–6.
d, Fluorescence spectra (10 μM RNA, 1 μM DFHO, ex. 495 nm for Squash and 505 nm for Corn) showed a red-shifted Squash emission maxima (562 nm) compared to Corn (545 nm), consistent with a different mode of interaction between DFHO and Squash compared to Corn. Squash also showed more than two-fold higher fluorescence intensity with DFHO compared to Corn.
e, Kd was measured by titration of 50 nM RNA with DFHBI-1T and then fitting the data using a one-site saturation model. Data represent mean values ± s.d. for n=3 independent experiments.
f, Binding kinetics were performed as reported previously50. The fluorescence signal trace was fitted with a monoexponential curve to extract kobs. kobs was plotted as a function of total RNA (50 nM RNA) and fluorophore concentration. kon and koff were extracted as the slope and intercept, respectively. Squash koff (0.014 ± 0.008 s−1) is very similar to that of Corn (0.018 ± 0.002 s−1). kon for Squash-DFHO (162300 ± 8100 M−1 s−1) is seven-times higher than Corn-DFHO (23000 ± 3000 M−1 s−1) which could be due to the high folding of Squash.
g,h, Kd measurements for Broccoli and Squash binding to BI (g) and DFHO (h) were performed as in panel e, using 50 nM RNA and then fitting the data using a one-site saturation model. Data represent mean values ± s.d. for n=3 independent experiments.

