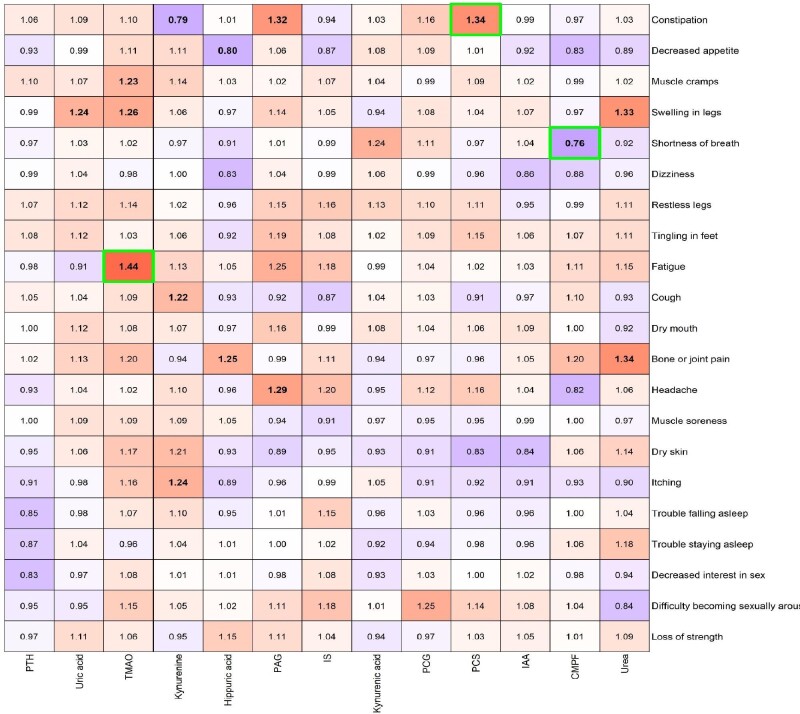
Figure 1.
Heat map of the ORs for the association between uremic toxins and symptoms, adjusted for age, primary renal disease, Charlson comorbidity score, ACR and eGFR (Supplementary data, Figure S1: unadjusted heat map). Bold ORs indicate statistical significance (P < 0.01) and green borders indicate statistical significance after adjustment for multiple testing.

