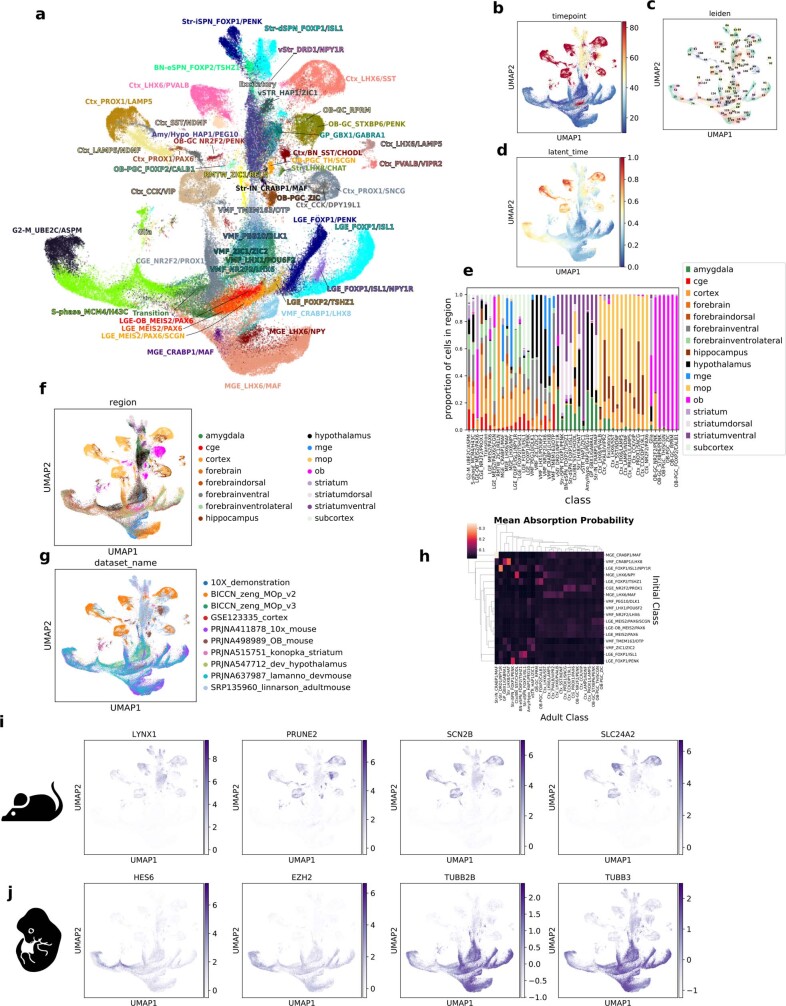
Extended Data Fig. 5. Inhibitory neurons of the developing and adult mouse forebrain.
a. UMAP projection of developing and adult mouse single cell RNAseq data, with initial and terminal classes labeled. b. UMAP of all mouse data, labeled by the post conception timepoint from which the cells are derived. c. UMAP of all mouse data, labeled by Leiden clusters used to determine terminal classes. d. UMAP of all mouse data, labeled by the scVelo dynamical shared latent time of each cell. e. Normalized stacked barplot, showing proportion of total cells of each class from each region. f. UMAP of all mouse data, labeled by the region from which the cells are derived. g. UMAP of all mouse data, labeled by the public dataset from which cells are derived. h. Heatmap representing the mean absorption probabilities of cells in each initial class to each terminal class. i. Selected genes differentially expressed in all terminal classes over all initial classes. j. Selected genes differentially expressed in initial classes over terminal classes.

