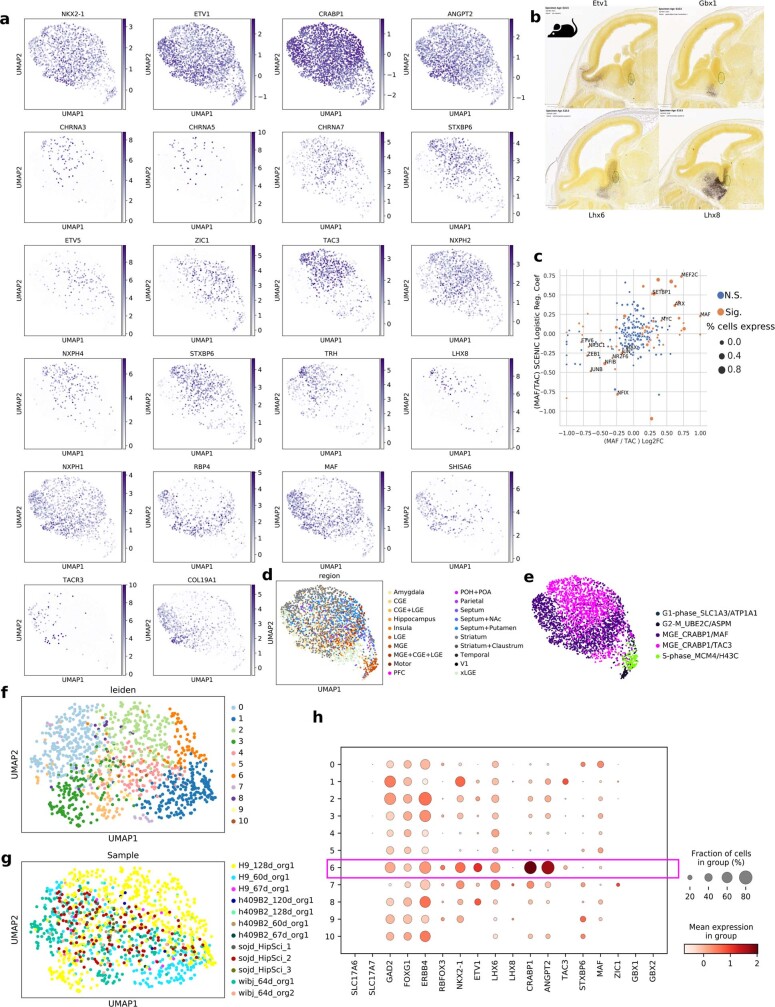
Extended Data Fig. 6. Expression of CRABP1+/TAC3+ and MAF+ striatal interneuron markers in developing macaque.
a. UMAP projection of NKX2-1/CRABP1+/ETV1+ cells only colored by scaled and normalized expression of TAC3 or MAF class markers. b. Allen Institute E15.5 mouse brain in situ hybridization showing expression of CRABP1+ neuron-related regional transcription factors. Green circle denotes boundary between Lhx8+ MGE and rostroventral MGE/septum known to produce cholinergic neurons and the Etv1+ MGE thought to produce CRABP1+ striatal interneurons, indicating partitioning of Etv1 and Lhx8 domains in mouse MGE. c. SCENIC module scores (Y-axis) vs log2 fold change of hub transcription factor predicted to regulate the module (X-axis). Significance represents multiple testing corrected q-value < 0.1 for both diffxpy differential expression in macaque and also q-value < 0.1 SCENIC logistic regression coefficient q-value calculated by shuffling class labels. Size represents the proportion of all CRABP1+ cells which also express the gene. d. UMAP projection showing the region from which macaque cells are derived. e. UMAP projection showing classes in cells expressing 2 or more of (CRABP1, ETV1, ANGPT2). f. Subclustering of rare NKX2-1+ cells from organoid dataset58, labeled by Leiden subclusters. g. NKX2-1+ cells from organoid dataset58, labeled by the experimental conditions of the differentiation. h. Dotplot of expression of MGE_CRABP1 related markers in Leiden subclusters showing cluster 6 likely contains MGE_CRABP1/MAF and MGE_CRABP1/TAC3 cells.

