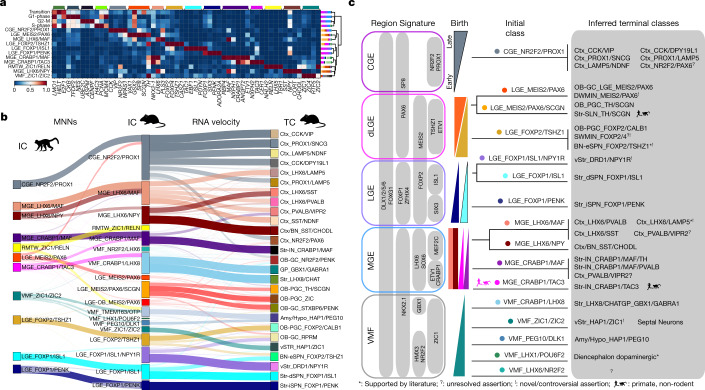
Fig. 2. Unified taxonomy of Euarchontogliran telencephalic IN specification.
a, Heatmap of macaque initial class marker expression, scaled by column. Stacked barplots correspond to region of origin for cells in each class. The dendrogram represents complete linkage of the Pearson correlation distance of mean expression values. Stacked bar plots show the regional distribution of each class. b, Sankey diagram in which the thickness of the lines between the left and middle columns represents the number of mutual nearest-neighbour (MNN) cells shared between each class and that between the middle and right columns reflects the initial class (IC) identity of the 100 cells with the highest (CellRank) probabilities of being absorbed in each terminal class (TC). c, Summarized taxonomy of initial and terminal classes observed in macaques and mice. Forked lines represent subclasses that become apparent postmitotically. Initial classes of INs are organized by the presumptive birthplace based on the expression of regional marker genes and putative birthdates, presented in the manner of Lim et al.5. Inferred terminal fates are based on our gene expression and histology analysis and the literature, as denoted and discussed in detail in Supplementary Table 4. S/DWMIN, superficial/deep white matter inhibitory neuron; BN, basal nuclei. RMTW_ZIC1/RELN and VMF_TMEM163/OTP were not included because they are excitatory cortical and hypothalamic classes, respectively.

