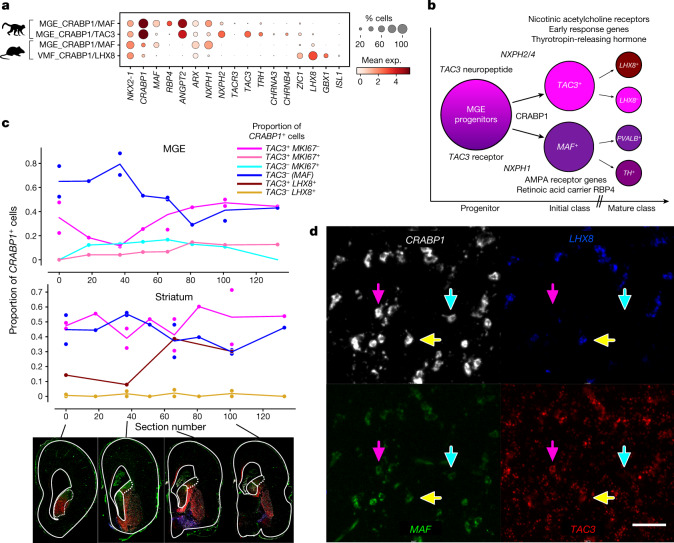
Fig. 3. Emergence of primate-specific MGE_CRABP1/TAC3 striatal INs.
a, Dot plot of expression of striatal IN marker genes. b, Schematic summarizing properties distinguishing new-born MGE CRABP1+TAC3+ and CRABP1+MAF+ neurons, from markers given in Supplementary Table 6. c, Line plots showing the Rostro–Caudal distribution of classes of CRABP1+ cells. TAC3– (MAF) denotes that the MAF class is inferred by the lack of TAC3, as distinct positive markers for this class are not apparent until later in differentiation. Each point is the sum of all cells in at least five random fields of view in each section/region. Cells were counted from whole-section scans of RNAscope in situ hybridization on representative sections (full size shown in Extended Data Fig. 8). The solid (dotted) outlines of the GE region in the images represents MGE (LGE). One individual was used with four pairs of tandem sections interspersed with four single sections. d, Representative image of MGE_CRABP1/MAF (blue arrows), MGE_CRABP1/TAC3 (pink arrows), MGE_CRABP1/TAC3/LHX8 (yellow arrows) and VMF_CRABP1/LHX8 INs (LHX8+TAC3− cells) in the putamen from section 66 (Extended Data Fig. 8c). Scale bar 50 μm.

