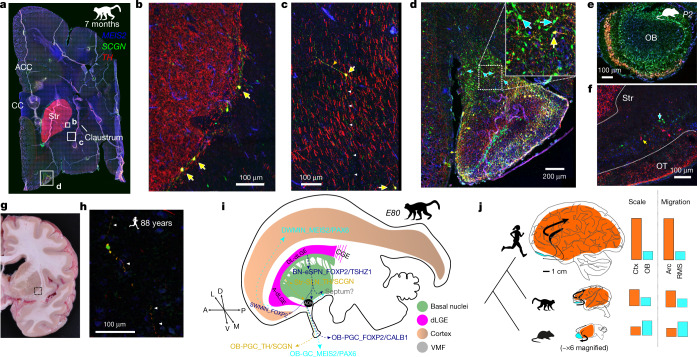
Fig. 5. Primate TH+ SLNs and ancestral olfactory populations.
All immunofluorescence images in this figure are of MEIS2, SCGN and TH. a, Seven-month-postnatal macaque coronal section including the remnant RMS. b, TH+ SLNs at the border of the striatum. MEIS2+SCGN+TH+ peristriatal SLNs are indicated by yellow arrows. c, SLNs in the claustrum with long, straight processes among dense TH+ midbrain–cortical fibre synapses including one TH+ process (orange arrowheads) and one TH− process (white arrowheads). d, Anterior olfactory nucleus at the olfactory peduncle, with MEIS2+SCGN+TH− cells (blue arrows) including SCGN+TH− fibres entering the ventral cortex (inset) and triple-positive cells (yellow arrows). e, Coronal section of mouse P2 OB showing SLN-analogous TH+SCGN+ cells. f, Mouse P2 coronal section showing the olfactory tubercle (OT) and striatum (Str) outlined by dotted lines, with only MEIS2+TH+ or MEIS2+SCGN+ cells. g, Photograph of a brain coronal slab from an 88-year-old human. The box shows the approximate location of the inset section block. h, TH+SCGN+ human SLN, with double-positive processes highlighted with white arrowheads. Only two cells were observed across this section. i, Schematic summarizing the unequal scaling of cortical and olfactory structures. j, Schematic summarizing migration of dLGE neurons and unequal evolutionary scaling of their destinations. Relative values in the bar plots are arbitrary.

