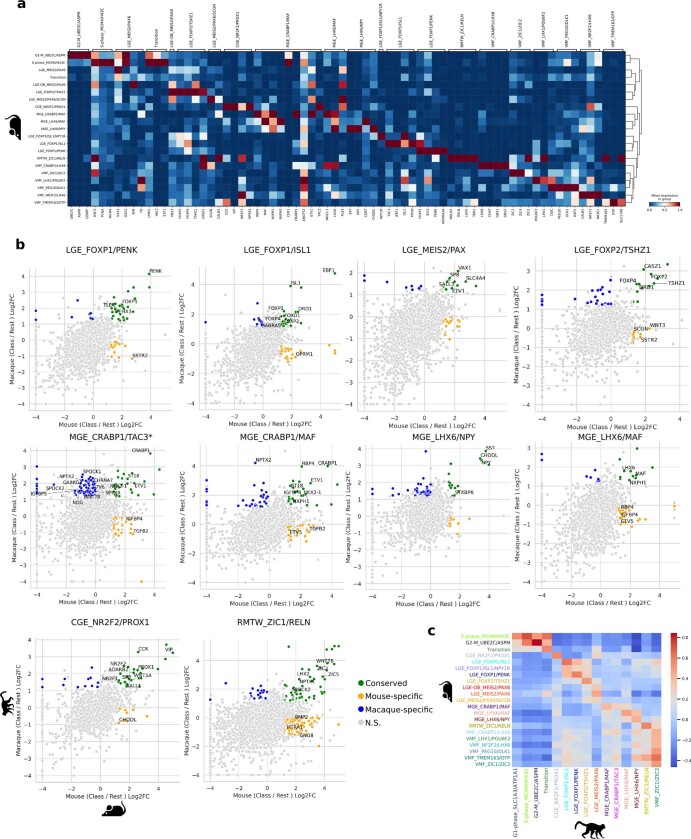
Extended Data Fig. 4. Markers of mouse and macaque initial classes.
a. Heatmap of mouse initial class marker genes selected from the top markers of each, scaled by column. b. Scatterplots of log 2 fold changes of each initial class vs the rest of the dataset for mouse vs macaque, with selected gene families of interest labeled. Conserved represents genes significantly upregulated in class vs rest in both species, Mouse-specific in mouse but not macaque, etc. N.S.= Not Significant in either species. Significance defined as |log2fc| > 1.2 and adjusted p value < .01, with significance marked "signif" in Supplementary Table 3. MGE_CRABP1/TAC3* is the comparison of macaque MGE_CRABP1/TAC3 vs mouse MGE_CRABP1/MAF, as this is the ancestral class comparison. Note that more genes show specific correlations to the macaque MGE_CRABP1/TAC3 class versus the macaque MGE_CRABP1/MAF class in the comparison to the single mouse MGE_CRABP1/MAF class. c. Pairwise Pearson correlations of mean gene expression in classes across species.

