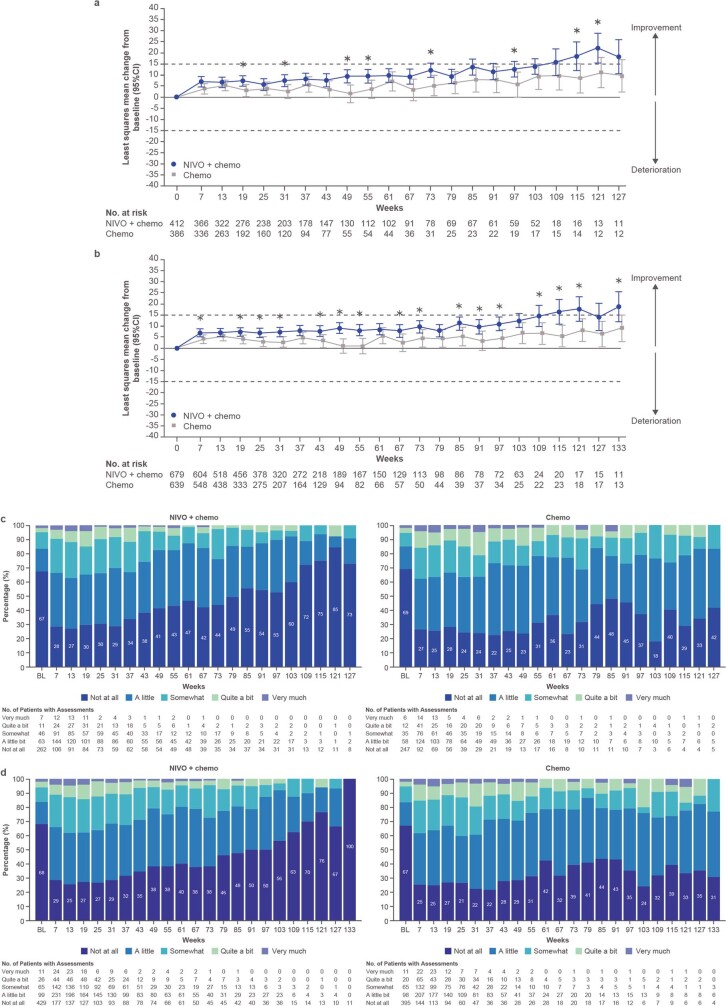
Extended Data Fig. 9. Patient-reported outcomes.
Least squares mean (95% CI) change from baseline in FACT-Ga total score with nivolumab plus chemotherapy versus chemotherapy in patients with PD-L1 CPS ≥ 5 (nivolumab plus chemotherapy, n = 412; chemotherapy, n = 386) (a) and in all randomized patients (nivolumab plus chemotherapy, n = 679; chemotherapy, n = 639) (b). Data in panels a and b are presented as least squares mean change from baseline and 95% CI. Top and bottom dashed lines indicate minimally important difference in score. The primary meaningful change threshold is 15.1. The P-value for the difference in least squares means was computed as the two-tailed probability using the t distribution. No adjustments were made for multiple comparisons. *P < 0.05; in patients with PD-L1 CPS ≥ 5, P-value was 0.022 at week 19, 0.024 at week 31, 0.002 at week 49, 0.028 at week 55, 0.015 at week 73, 0.041 at week 97, 0.039 at week 115, and 0.025 at week 121. In all randomized patients, P-value was 0.026 at week 7, 0.020 at week 19, 0.012 at week 25, 0.006 at week 31, 0.025 at week 43, <0.001 at week 49, 0.002 at week 55, 0.037 at week 67, 0.030 at week 73, 0.033 at week 85, 0.028 at week 91, 0.012 at week 97, 0.024 at week 109, 0.004 at week 115, 0.013 at week 121, and 0.039 at week 133; not formally tested. FACT-Ga GP5 (“I am bothered by side effects of treatment”) item values in patients with PD-L1 CPS ≥ 5 (c) and in all randomized patients (d). Chemo, chemotherapy; CPS, combined positive score; FACT-Ga, Functional Assessment of Cancer Therapy-Gastric; NIVO, nivolumab; PD-L1, programmed death ligand 1.

