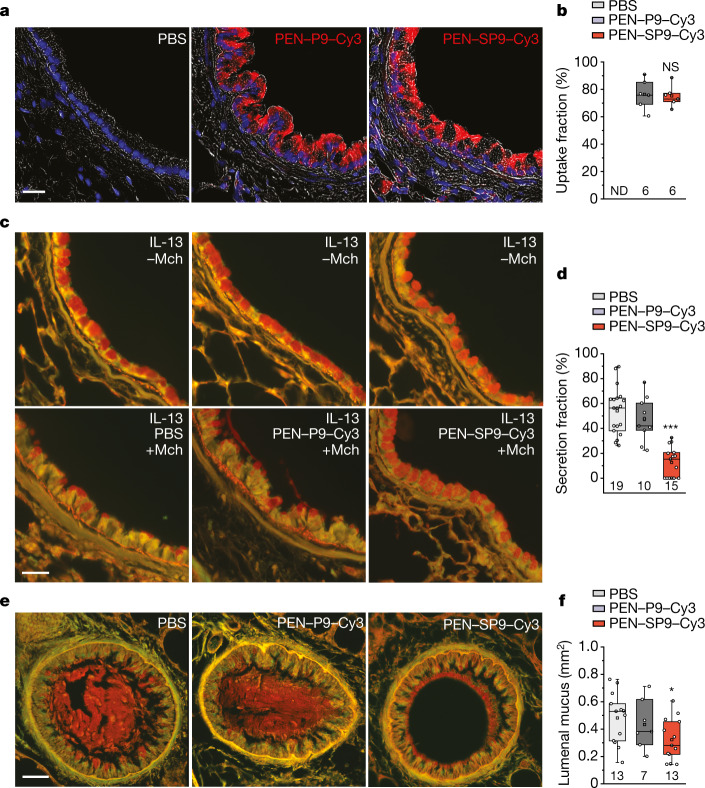
Fig. 5. SP9 inhibits mucin secretion and mucus occlusion in mice.
a, Transverse sections of mouse bronchial airways showing intracellular uptake of peptides (200 μM microsprayer concentration; Cy3 is visualized in red). Nuclei fluoresce blue (DAPI), overlaid on bright-field images. Scale bar, 25 µm. b, Averaged uptake fractions for two independent experiments for a total n cells (indicated below each box plot) per group (Supplementary Table 1). Total of n = 260 (PEN–SP9–Cy3) and n = 361 (PEN–P9–Cy3) cells (6 sections from 3 mice per peptide). Statistical analysis was performed using a two-tailed unpaired Student’s t-test, showing a non-significant difference (P = 0.83). ND, not detected. c, Fractional mucin secretion was measured by analysis of images of mouse airways treated with IL-13 to induce mucous metaplasia (top row), followed by stimulation of secretion with methacholine or PBS as control (bottom row). The sections were taken 3 mm distal to those in Fig. 1. Mice that were pretreated with PBS or PEN–P9–Cy3 show greater reductions in intracellular mucin content (PAFS stain (red)) in response to methacholine compared with mice that were pretreated with PEN–SP9–Cy3. Scale bar, 25 µm. d, Fractional mucin secretion measured as in c. Box plots and data points are shown for two independent experiments for a total n mice (indicated below each box plot) per group. Statistical analysis was performed using a two-tailed unpaired Student’s t-test, showing a significant difference between mice that were pretreated with PEN–SP9–Cy3 compared with those that were pretreated with PBS; ***P = 0.00000001. e, Airway lumenal mucus was measured by image analysis as in Fig. 1, except that the right lungs were examined instead of the left lungs. Scale bar, 25 µm. f, The sum of lumenal mucus cross-sectional area in the caudal lobe of the right lung measured at 500 µm intervals. Box plots and data points are shown for two independent experiments combined for a total n mice (indicated below each box plot) per group. Statistical analysis was performed using a two-tailed unpaired Student’s t-test, showing a significant difference between mice that were pretreated with PEN–SP9–Cy3 compared with those that were pretreated with PBS; *P = 0.027.

