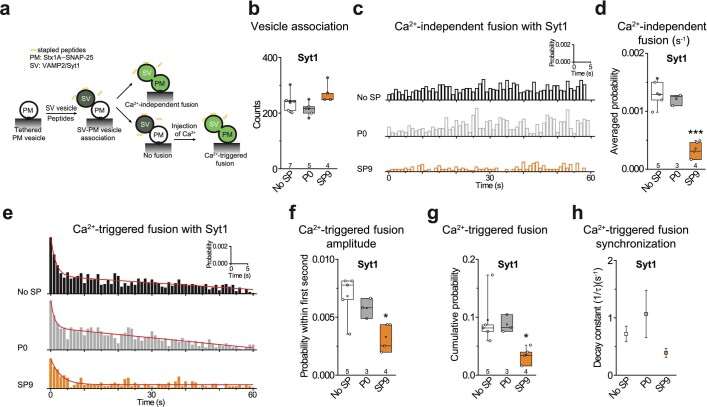
Extended Data Fig. 4. Related to Figure 3. SP9 inhibits both Ca2+-independent and Ca2+-triggered vesicle fusion with reconstituted neuronal SNAREs and Syt1.
a, Schematic of the single vesicle content mixing assay. Neuronal PM: plasma membrane mimic vesicles with reconstituted Stx1A and SNAP-25A; SV: synaptic vesicle mimic with reconstituted VAMP2 and Syt1. After SV - neuronal PM vesicle association, vesicle pairs either undergo Ca2+-independent fusion or remain associated until fusion is triggered by Ca2+ addition. 10 μM of P0 or SP9 was added together with SV vesicles and was present in all subsequent stages. b, Effect P0 and SP9 on vesicle association. c, Corresponding Ca2+-independent fusion probabilities. d, Corresponding average probabilities of Ca2+-independent fusion events per second (*** p = 0.00022). e, Corresponding Ca2+-triggered fusion probabilities. (f–h) Corresponding Ca2+-triggered fusion amplitudes of the first 1-sec time bin upon 500 μM Ca2+-injection (f) (* p = 0.017), the cumulative Ca2+-triggered fusion probability within 1 min (g) (* p = 0.039), and the decay rate (1/τ) of the Ca2+-triggered fusion histogram (h). The fusion probabilities and amplitudes were normalized to the number of analysed neuronal SV - neuronal PM vesicle pairs (Supplementary Table 2). Panels b, d, f, g show box plots and data points for n (indicated below each box plot) independent repeat experiments (Supplementary Table 2). Two-tailed Student’s t-tests were used for SP9 vs. No SP. Decay constants (boxes) and error estimates (bars) in panels h computed from the covariance matrix upon fitting the corresponding histograms combining all repeats with a single exponential decay function using the Levenberg-Marquardt algorithm.

