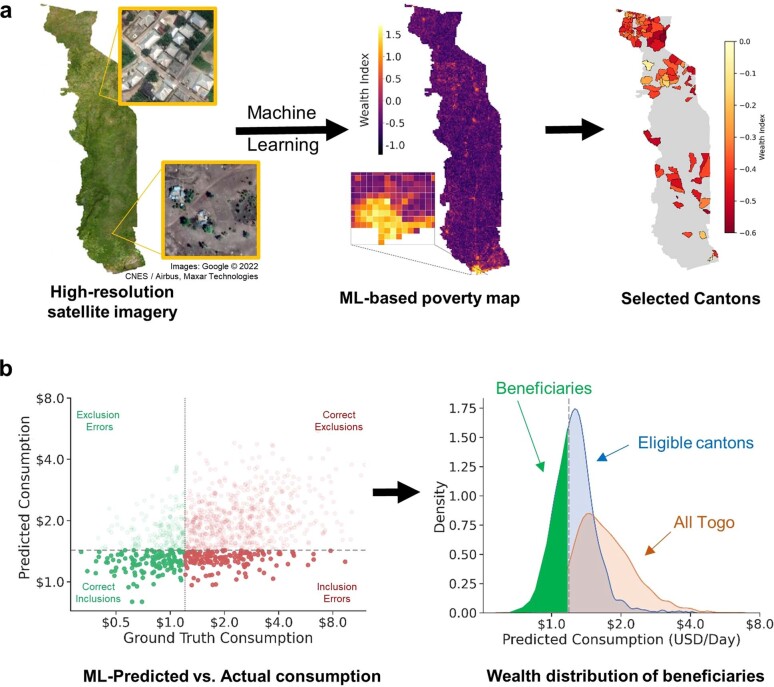
Extended Data Fig. 1. Overview of targeting methodology.
a) Regional targeting. Satellite imagery of Togo59 is used to construct micro-estimates of poverty (middle)16, which are overlayed with population data to produce canton-level estimates of wealth. Individuals registered in the 100 poorest cantons (right) are eligible for benefits. Inset images © 2019 Google. b) Individual targeting. A machine-learning algorithm is trained using representative survey data to predict consumption from features of phone use (Methods, ‘ Machine-learning methods’). The algorithm constructs poverty scores that are correlated with ground-truth measures of consumption (left). Subscribers who register for the program in targeted cantons with estimated consumption less than USD $1.25/day are eligible for benefits (right). The red distribution shows the predicted wealth distribution of the entire population of Togo; the blue distribution shows the predicted wealth distribution in the 100 poorest cantons; and the green section indicates the predicted wealth distribution of Novissi beneficiaries.

