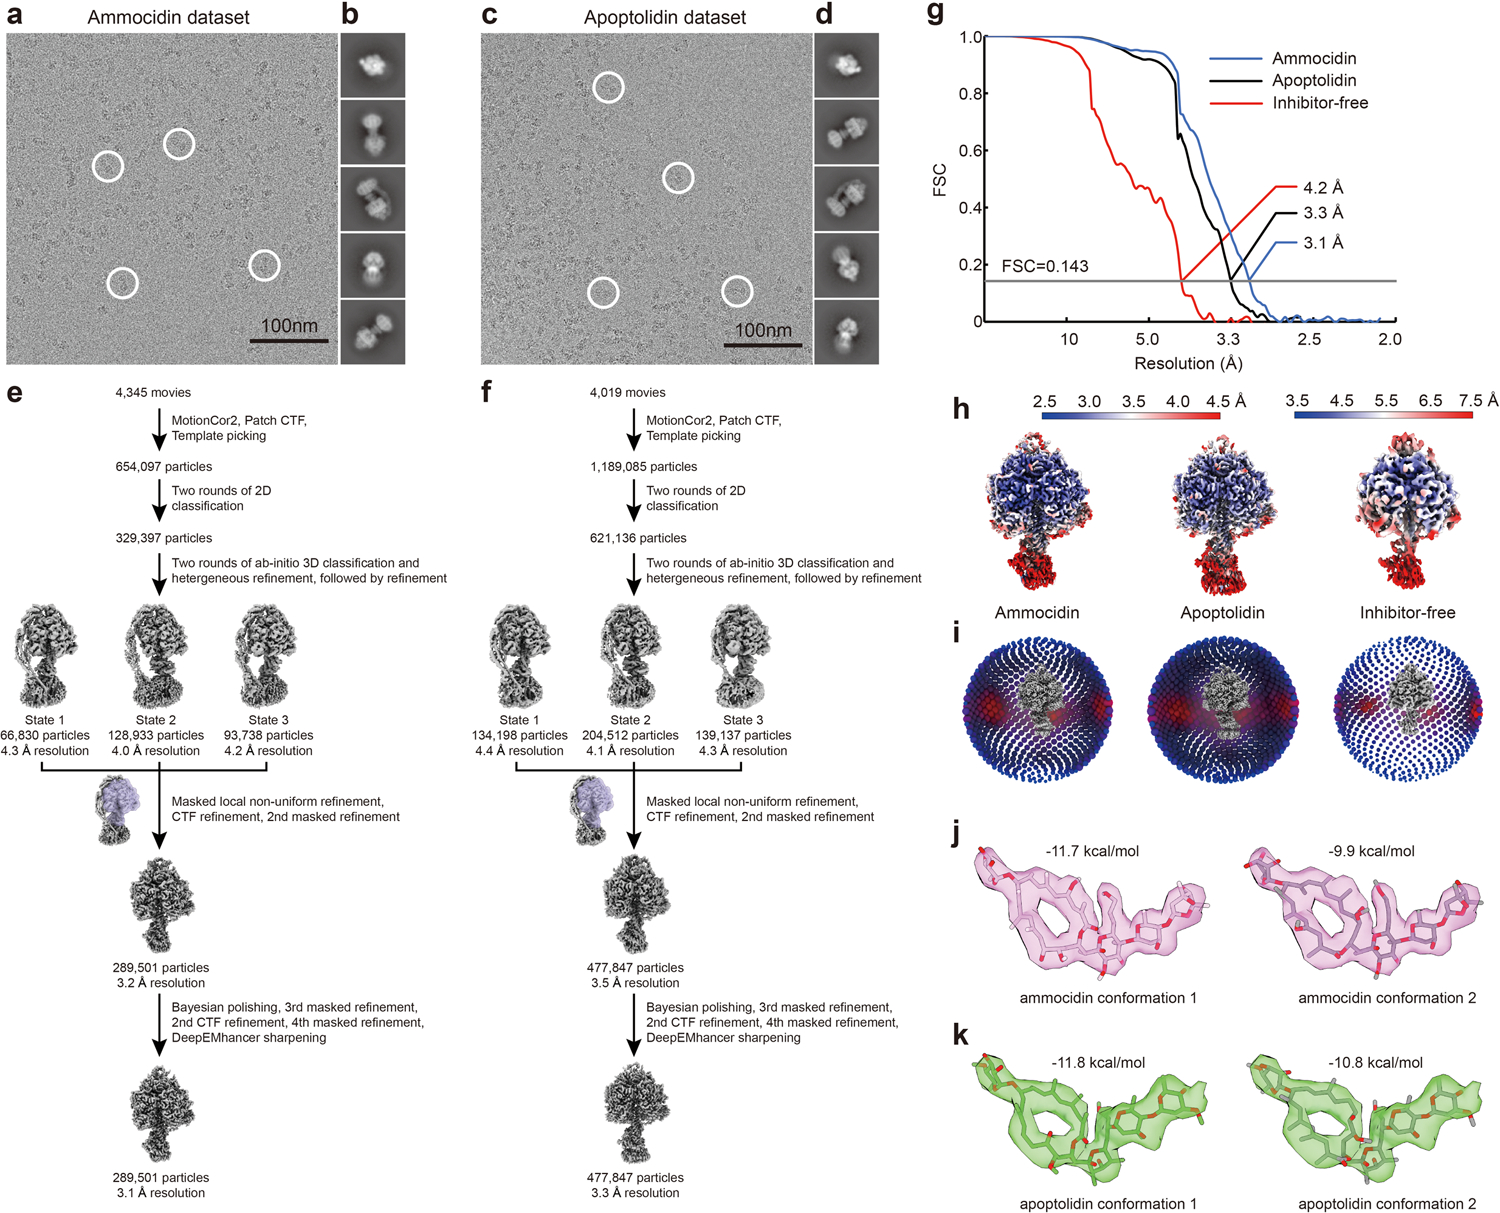
Extended Data Fig. 4: Workflow for cryoEM image analysis and validation for ammocidin-bound and apoptolidin-bound yeast ATP synthase.

Example micrographs (a, c), 2D class average images (b, d), and workflow for obtaining maps of the F1 regions (e, f) for ammocidin-bound, and apoptolidin-bound ATP synthases, respectively. Corrected Fourier shell correlation curves after gold-standard refinement g, local resolution maps h, and orientation distribution plots i, are shown for the maps of the F1 regions of the ammocidin-bound, apoptolidin-bound, and inhibitor-free datasets. Alternative conformations of ammocidin (j) and apoptolidin (k) atomic models.
