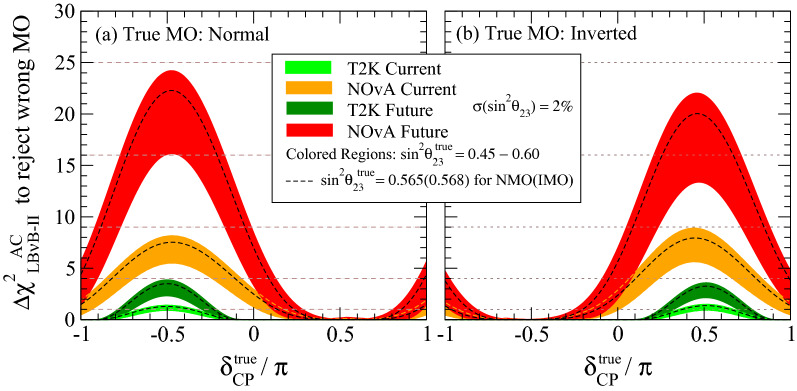
Figure 2.
LBB-II mass ordering sensitivity. The Mass Ordering (MO) sensitivity of LBB-II experiments via the appearance channel (AC), constrained to a range of , is shown as a function of the “true” value of . The bands represent the cases where the “true” value of lies within the interval [0.45, 0.60] with a relative experimental uncertainty of 2%. The (0.45) gives the maximum (minimum) sensitivity for a given value of . The black dashed curves indicate the NuFit5.0 best fitted value. The NMO and IMO sensitivities are illustrated respectively in the (a) and (b) panels. The sensitivity arises from the fake CPV effect due to matter effects, proportional to the baseline (L). The strong dependence on is due to the unavoidable degeneracy between NMO and IMO, thus causing the sensitivity to swig by 100%. T2K, now (light green) and future (dark green), exhibits minimal intrinsic sensitivity due to its shorter baseline ( km). Instead, NOvA, now (orange) and future (red), hold leading order MO information due to its larger baseline ( km). The future full exposure for T2K and NOvA implies times more statistics relative to today. These curves are referred to as and were derived from data as detailed in Appendix A.

