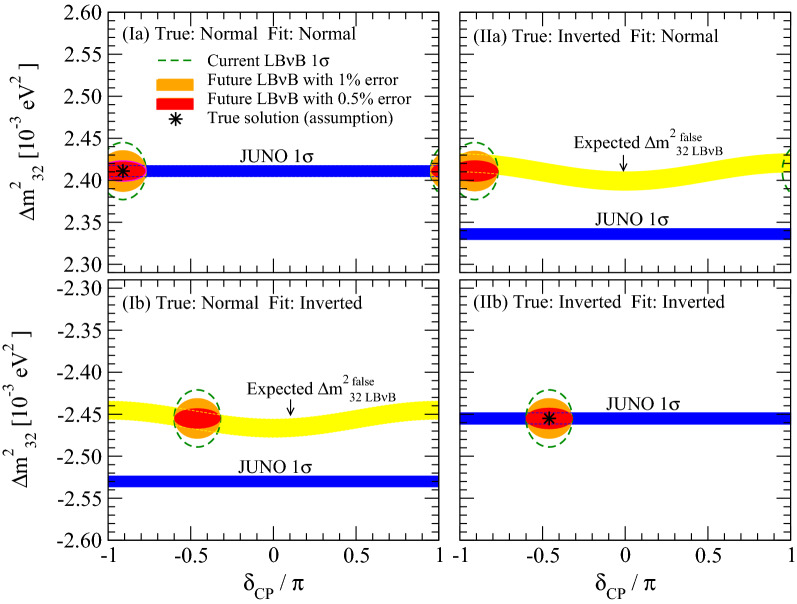
Figure 3.
Origin of MO Boosting by LBB for JUNO. Semi-quantitative and schematic illustration of the LBB JUNO MO resolution synergy is shown for the cases where the true MO is normal (left panels) or inverted (right panels). For each case, the true values of are assumed to coincide with the NuFit5.0 best fitted values indicated by the black asterisk symbols. For each assumed true value of , possible range of the false values of to be determined from LBB DC is indicated by the yellow color bands where their width reflects the ambiguity due to the CP phase (see Appendix C). The approximate current 1 allowed ranges of () from NuFit5.0 are indicated by the dashed green curve whereas the future projections assuming the current central values with 1% (0.5%) uncertainty of are indicated by filled orange (red) color. Expected 1 ranges of from JUNO alone are indicated by the blue color bands though the ones in the wrong MO region would be disfavored at confidence level (CL) by JUNO itself. When the MO which is assumed in the fit coincides with the true one, allowed region of by LBB overlaps with the one to be determined by JUNO as shown in the panels I(a) and II(b). On the other hand, when the assumed (true) MO and fitted one do not coincide, the expected (false) values of by LBB and JUNO do not agree, as shown in the panels I(b) and II(a), disfavouring these cases, which is the origin of what we call the boosting effect in this paper.

