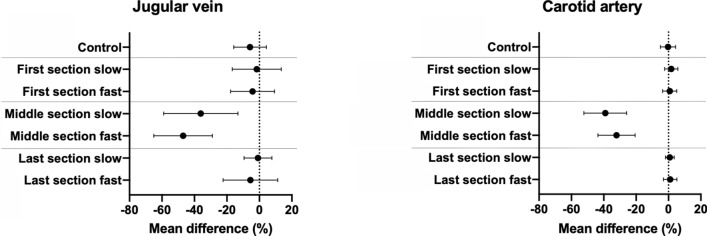
Figure 3.
Impact of motion corruption in each section of the scan. The graphs show the mean differences (± SD) between the baseline (motion free) acquisition and each category of motion corrupted acquisition for the jugular vein (left) and carotid artery (right). Acquisitions corrupted with motion during the middle section showed significantly lower blood flow measurements compared to the baseline scan. However, acquisitions corrupted with motion in the other two sections, showed no significant bias compared to the baseline scan.

