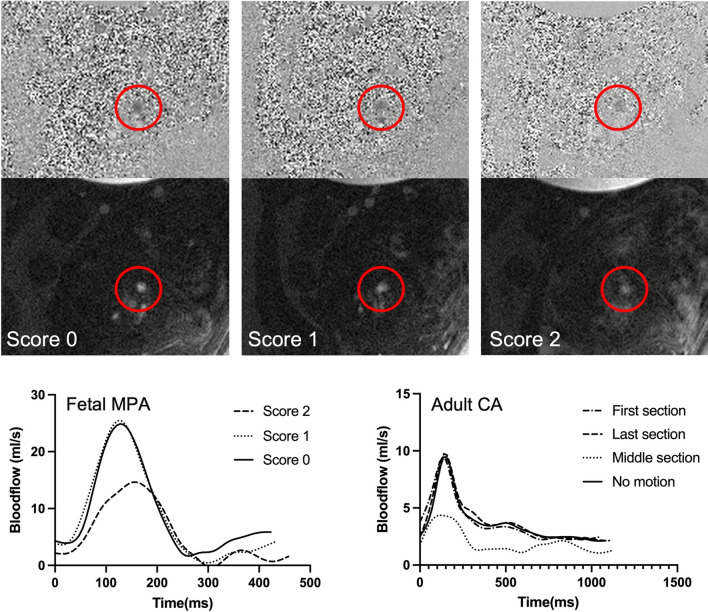
Figure 6.
Examples for fetal flow measurements with different scores. Acquisitions of the fetal MPA in the same fetus rated with three different images scores due to different levels of motion corruption. The top row shows the velocity images with the referring magnitude image below. The red circles mark the MPA. The graph at the bottom left shows the flow curves for the acquisitions of the fetal MPA above. On the bottom right, concordant flow curves of measurements in the carotid artery (CA) of an adult during motion corruption in the different sections are displayed.

