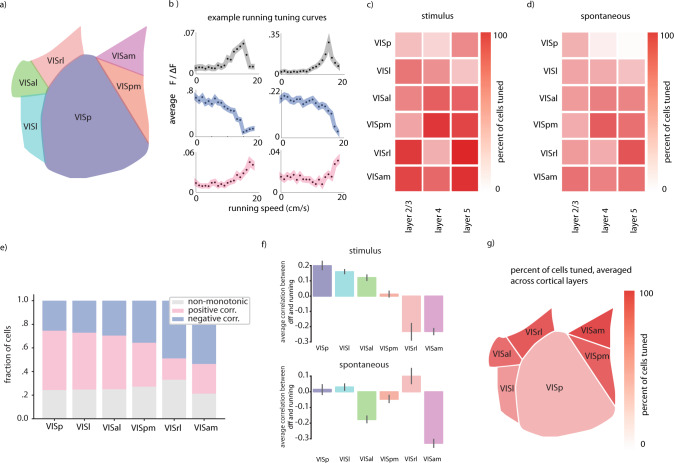
Fig. 1. Net correlation between neural activity and locomotion varies widely across different extrastriate regions.
a Schematic of regions included in study. b Example non-monotonic, monotonically decreasing, and monotonically increasing tuning curves for running speed, top to bottom. Example cells are VISp layer 2/3. Error envelope represents standard error margin. c Overall fraction of neurons significantly tuned to running in each region and Cre-line, calculated during visual stimulus presentation. d Same as (c) except calculated in the absence of visual stimuli. e Fraction of cells displaying different tuning types to running speed across the visual regions we examined. f Average correlation coefficient between neural activity and running in each visual region, amongst neurons displaying significant (p < 0.05) monotonic tuning to running. Error bars are 95% confidence interval for the mean estimate calculated via 1000 bootstraps. g Visualization of spatial distribution of overall tuning to running in the visual regions. Cell numbers included in each analysis can be found in Supplementary Fig. 1. Source data are provided as a Source Data file.

