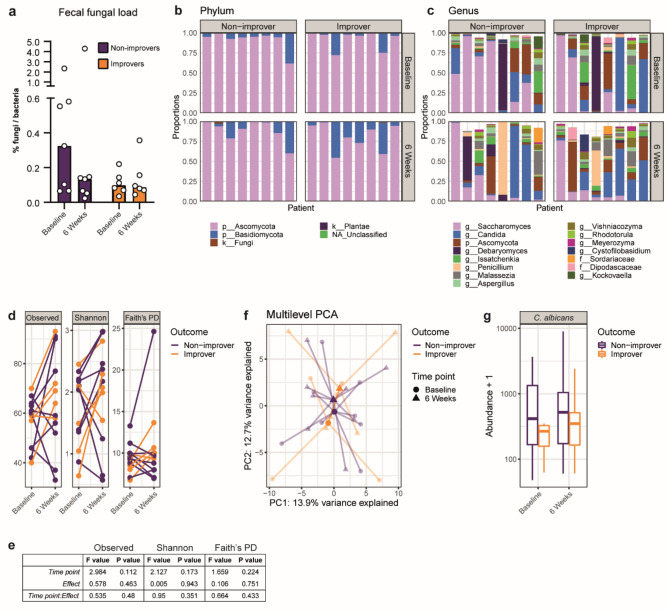
Figure 1.
Fecal mycobiota analysis reveals no differences with respect to sensitivity status. (a) Fungal load determination by FungiQuant qPCR. (b), (c) Taxonomic analysis of sequenced samples on relative abundance of top 5 phyla (b) and top 15 genera (c). (d), (e) α-diversity metrics according to number of observed species, Shannon diversity, Faith’s Phylogenetic Diversity (PD). Linear Mixed Effects model results presented in (e). (f) Community analysis by multilevel principal component analysis. Bold symbols represent centroids of each sample group, while light symbols indicate individual samples. (g) Abundance of Candida albicans based on ITS1 sequencing reads.

