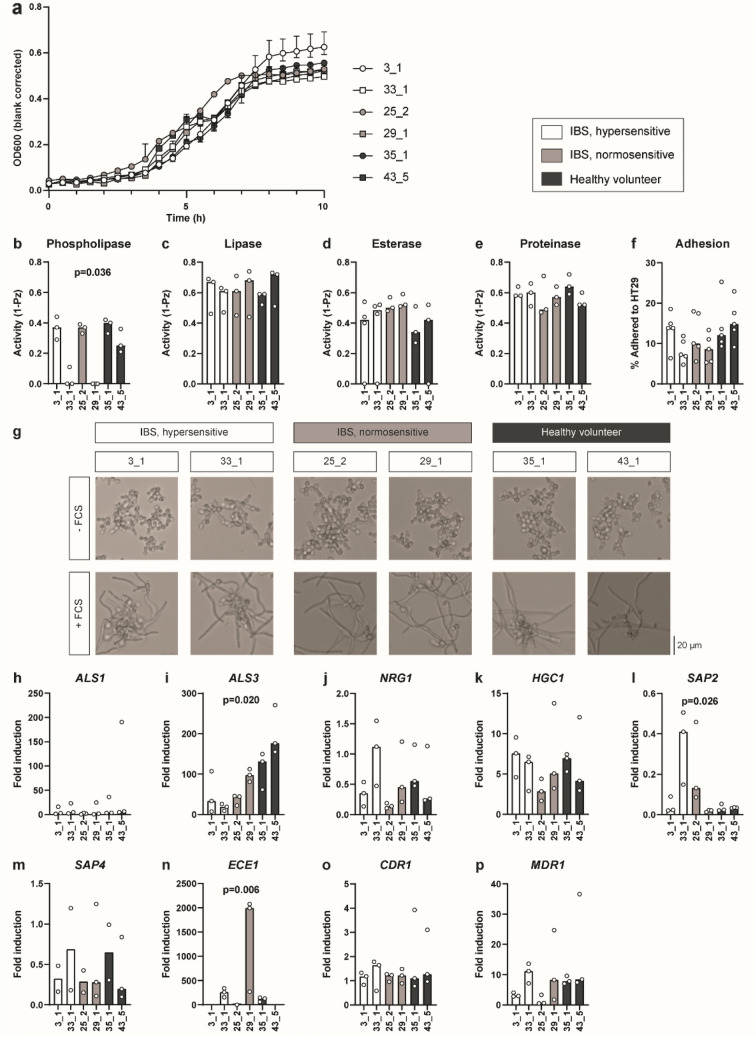
Figure 3.
Phenotypic assessment of fecal C. albicans isolates reveals strain-level differences. (a) Growth curve of 6 selected C. albicans strains. IBS-H, hypersensitive IBS patients; IBS-N, normosensitive IBS patients; HV, healthy volunteer. Data shown as median and range (n = 3). (b)–(e) Phenotypic assessment of phospholipase, lipase, esterase, and protease activity. Activity is determined by measuring halo size relative to colony size (n = 3–4). (f) Adhesion of yeast strains to HT-29 colon carcinoma monolayers, expressed as percentage of added cells (n = 5). g) Representative photographs of FCS-induced morphogenesis. Magnification 20 × . (h)–(p) Induction of hyphae-formation related genes, virulence factors, and drug-resistance genes upon addition of FCS, expressed as fold induction relative to unstimulated yeast samples. Experiment performed in triplicate, missing values are due to no detection of transcript. Significances tested using Kruskal–Wallis test. Data shown as median and individual datapoints. FCS, fetal calf serum.

