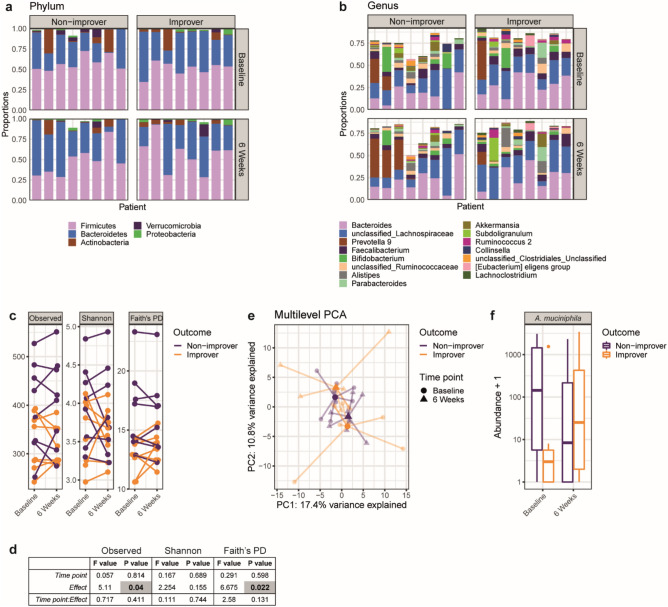
Figure 4.
Fecal bacterial microbiome analysis indicates association of α-diversity metrics, composition, and Akkermansia muciniphila with changing sensitivity status. (a), (b) Taxonomic representation of all samples on relative abundance of top 5 phyla (a) or top 15 genera (b). Patients are grouped based on a normalization of sensitivity status (improvers), or unaltered sensitivity status (non-improvers) over the course of six weeks. Each column represents paired samples of one patient at baseline and 6 weeks. (c), (d) Microbial richness described according to α-diversity metrics Observed species, Shannon index, and Faith’s Phylogenetic Diversity (PD). Observed species and Faith’s PD are generally lower for improvers. Results of linear mixed effects model presented in (d). (e) Community analysis by multilevel principle component analysis (p = 0.002, PERMANOVA). Bold symbols represent centroids of each sample group, while light symbols indicate individual samples. (f) Abundance of Akkermansia muciniphila is associated with the change in sensitivity status (p = 0.007, LME).

