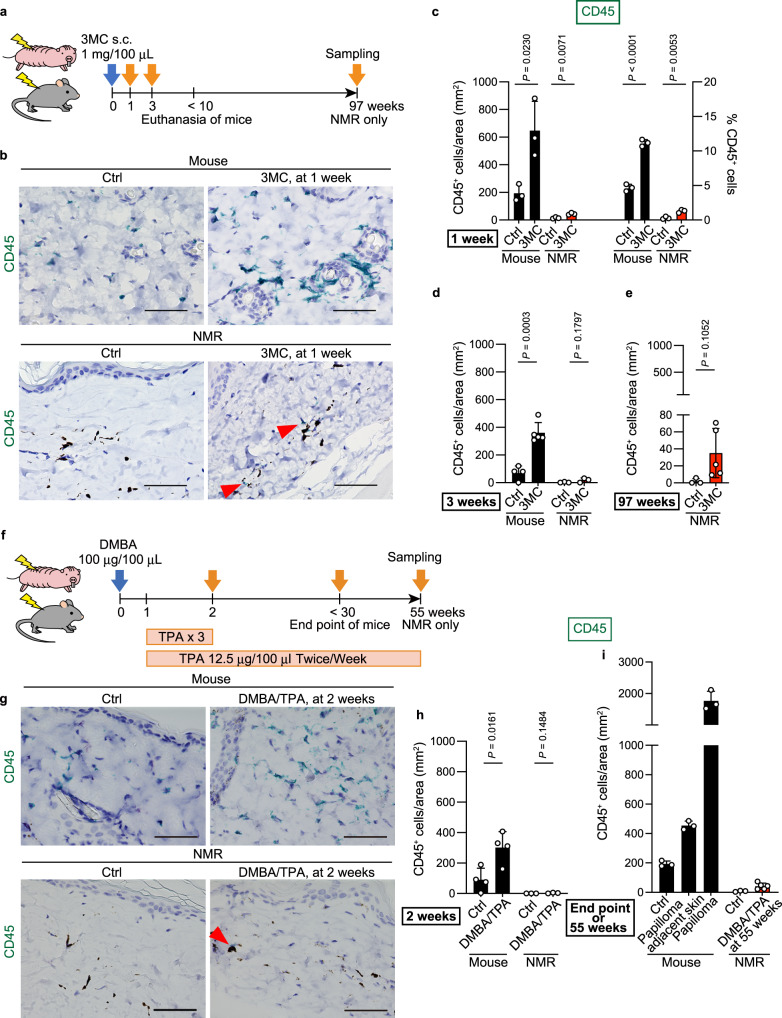
Fig. 3. Attenuated infiltration of inflammatory immune cells in naked mole-rat (NMR) tissue upon administration of carcinogens.
a Schematic diagram for investigating immune cell infiltration into the skin after a subcutaneous (s.c.) injection of 3-methylcholanthrene (3MC). b Immunohistochemical detection of CD45 (green)-positive cells in skin sections 1 week after s.c. injection of 3MC. Black dots indicate melanin pigments in NMR dermis. Scale bar: 50 μm. Red arrowheads show positive cells in NMRs. Quantification of CD45-positive cells per area and/or total cells in skin sections at 1 (c), 3 (d), and 97 (e) weeks after s.c. injection of 3MC. f Schematic diagram for investigating immune cell infiltration into the skin after exposure to 7,12-dimethylbenz[a]anthracene (DMBA)/12-O-tetradecanoylphorbol-13-acetate (TPA). g Immunohistochemical detection of CD45 (green)-positive cells in skin sections at 2 weeks after exposure to DMBA/TPA. Scale bar: 50 μm. Red arrowhead shows a positive cell in NMRs. h and i Quantification of CD45-positive cells per area in skin sections at 2 (h), and 55 weeks (i) after exposure to DMBA/TPA. Mice were analysed at the end point (i). “Papilloma adjacent skin” is the no-papilloma region from DMBA/TPA-treated mouse skin. For quantification, data are presented as the mean ± SD of n = 3 (for c, mouse of i, NMR of d and h, control NMR of e and i), n = 4 (for control mouse of d, mouse of h) or n = 5 (for 3MC mouse of d, 3MC NMR of e, DMBA/TPA NMR of i) animals. Unpaired t-test versus untreated control (Ctrl).

