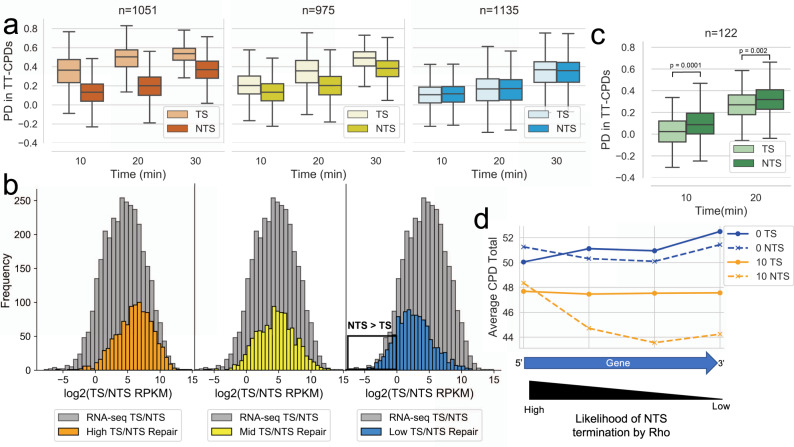
Fig. 2. TCR occurs in sense, antisense, and intergenic regions.
a The recovery of TT-CPD lesions at 10, 20, and 30-min recovery timepoints in WT cells. Genes were split by transcription level based on RNA-seq data: high = orange, mid = yellow, and low = blue (for details on how genes were split, see Methods). b The sense/antisense (TS/NTS) transcription ratio of high (orange), mid (yellow) and low (blue) repair genes. Genes were split into three equal repair levels based on their TS/NTS percent decrease (PD) ratio from CPD-seq data after 20 min of recovery. The grey histogram represents the TS/NTS transcription ratio of all genes. The black box highlights genes with an antisense transcription preference. c The recovery of TT-CPD lesions in genes that have at least a 1.5-fold antisense preference. The box shows the interquartile range (IQR), the line shows the median, and the whiskers extend to 1.5xIQR. The top of the box represents the 75th percentile and bottom represents the 25th percentile. n denotes the number of genes in each plot. P-values were calculated using a paired Wilcoxon signed rank test. d Meta-analysis displaying the TT-CPD total in genes with an antisense transcription preference at their gene end at the 0 min and 10 min timepoint. Each point represents a window encompassing a quarter of the gene.

