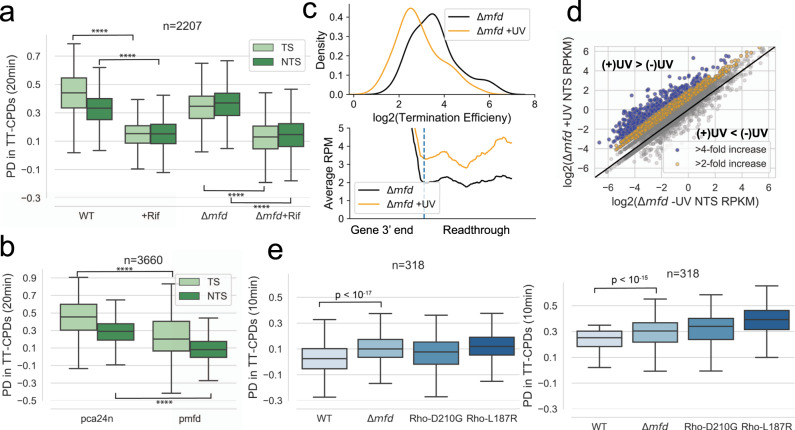
Fig. 5. The role of Mfd in repair.
a The percent decrease in TT-CPDs of the TS and NTS of gene bodies in WT, WT + Rif, Δmfd and Δmfd + Rif. (****p < 10−277). b The percent decrease in TT-CPDs of the TS and NTS of gene bodies in cells overexpressing Mfd. (****p < 10−308). c The distribution of the log2 termination efficiency (see methods) at Rho-dependent terminators in the absence or presence of UV exposure in Δmfd cells (top). Meta-analysis of readthrough (see methods) past Rho-dependent termination sites in the absence or presence of UV exposure in Δmfd cells (bottom). d Scatterplot comparing the NTS RPKM (RNA-seq) in Δmfd vs Δmfd + UV (120 J/m2) cells. Genes are colored based on their fold increase after UV exposure compared to without UV. Blue genes had a greater than 4-fold increase in antisense transcription and yellow genes had a 2-4-fold increase in antisense transcription. e The percent decrease in TT-CPDs of the NTS in gene bodies where Mfd deletion increases NTS transcription. The box shows the interquartile range (IQR), the line shows the median, and the whiskers extend to 1.5xIQR. The top of the box represents the 75th percentile and bottom represents the 25th percentile. n denotes the number of genes in each plot. P-values were calculated using a paired Wilcoxon signed rank test.

