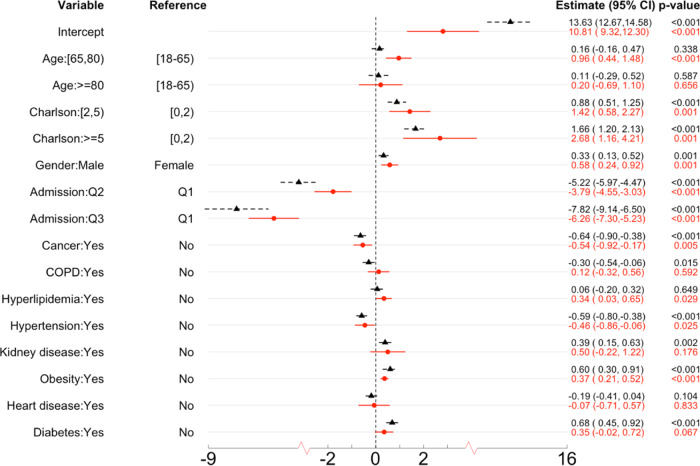
Fig. 6. The estimated fixed effects and 95% confidence intervals in the COVID-19 LOS study.
The dashed and black CIs are the results using only the 4 UHG sites (the UHG database contains n = 47,756 patients and is divided into four sites, i.e., Northeast, South, Midwest, and West), the solid and red CIs are the results using all 14 sites with n = 120,609 patients. The results are obtained by using the DLMM algorithm to integrate aggregated data from the multiple sites. The 95% CIs are presented as point estimate ±1.96 * standard error estimate. The corresponding p-values are based on two-sided Wald tests.

