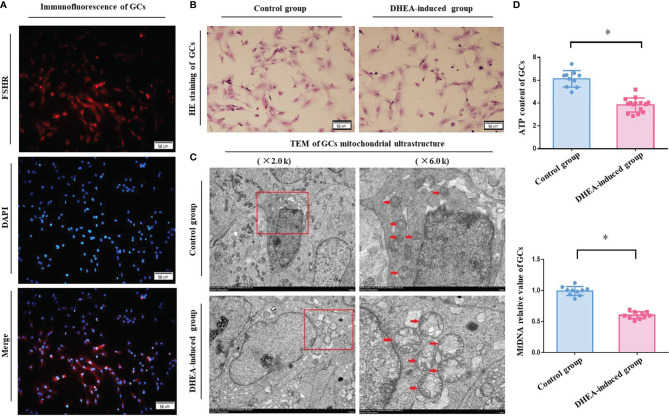
Figure 2.
(A) The specific expression of FSHR in rat ovarian GCs was identified by immunofluorescence. The fluorescent microscopy (Leica) results showed a specific red fluorescence in the cytoplasm of positive cells, blue fluorescence in the nucleus of negative control cells and no red fluorescence in the cytoplasm. Merge represents the fusion of two colored images. (B) Morphological observation of rat ovarian GCs stained with HE. HE staining coverslips showed that the rats ovarian GCs were intact with pink cytoplasm and red-purple round nuclei, and there were no obvious difference between two groups under light microscopy. (C) The mitochondrial ultrastructure of rat ovarian GCs were analyzed by TEM. As shown by the red arrow in the photos, GCs had a normal nucleus with a clear nucleoli and double nuclear membranes, and the mitochondria had a clear mitochondrial crista around the nucleus in control group. However, the ovarian GCs presented mitochondrial aggregated distribution, crista dissolution and fracture and mitochondria with vacuoles in PCOS model group rats. (D) The ATP content and mtDNA copy number of rat ovarian GCs were detected. According to the analysis, the ATP content (4.51 ± 0.49 μm) and the mtDNA copy number (0.58 ± 0.12) of the ovarian GCs in PCOS model group rats were significantly decreased compared with those in control group rats (ATP, 6.53 ± 0.41 μm; mtDNA, 1.00 ± 0.19). *P < 0.05.

